
Page 370 - Six Sigma Demystified
P. 370
350 Six SigMa DemystifieD
Regression Analysis
tip: When working with data from designed experiments, use the regression
analysis tools described under “Factorial Designs” above and “Response Surface
Analysis” below.
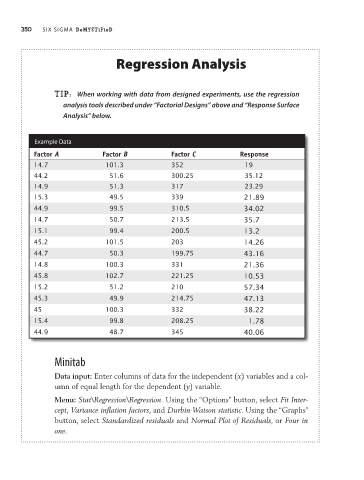
Example Data
Factor A Factor B Factor C Response
14.7 101.3 352 19
44.2 51.6 300.25 35.12
14.9 51.3 317 23.29
15.3 49.5 339 21.89
44.9 99.5 310.5 34.02
14.7 50.7 213.5 35.7
15.1 99.4 200.5 13.2
45.2 101.5 203 14.26
44.7 50.3 199.75 43.16
14.8 100.3 331 21.36
45.8 102.7 221.25 10.53
15.2 51.2 210 57.34
45.3 49.9 214.75 47.13
45 100.3 332 38.22
15.4 99.8 208.25 1.78
44.9 48.7 345 40.06
Minitab
Data input: Enter columns of data for the independent (x) variables and a col-
umn of equal length for the dependent (y) variable.
Menu: Stat\Regression\Regression. Using the “Options” button, select Fit Inter-
cept, Variance inflation factors, and Durbin-Watson statistic. Using the “Graphs”
button, select Standardized residuals and Normal Plot of Residuals, or Four in
one.