
Page 372 - Six Sigma Demystified
P. 372
352 Six SigMa DemystifieD
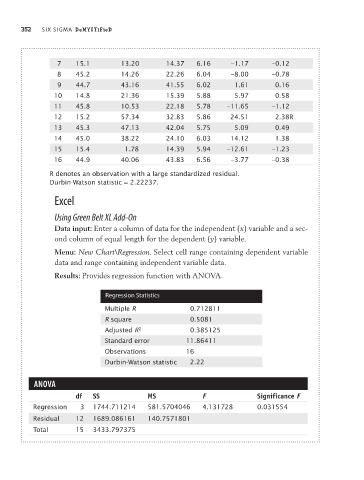
7 15.1 13.20 14.37 6.16 –1.17 –0.12
8 45.2 14.26 22.26 6.04 –8.00 –0.78
9 44.7 43.16 41.55 6.02 1.61 0.16
10 14.8 21.36 15.39 5.88 5.97 0.58
11 45.8 10.53 22.18 5.78 –11.65 –1.12
12 15.2 57.34 32.83 5.86 24.51 2.38R
13 45.3 47.13 42.04 5.75 5.09 0.49
14 45.0 38.22 24.10 6.03 14.12 1.38
15 15.4 1.78 14.39 5.94 –12.61 –1.23
16 44.9 40.06 43.83 6.56 –3.77 –0.38
R denotes an observation with a large standardized residual.
Durbin-Watson statistic = 2.22237.
Excel
Using Green Belt XL Add-On
Data input: Enter a column of data for the independent (x) variable and a sec-
ond column of equal length for the dependent (y) variable.
Menu: New Chart\Regression. Select cell range containing dependent variable
data and range containing independent variable data.
Results: Provides regression function with ANOVA.
Regression Statistics
Multiple R 0.712811
R square 0.5081
Adjusted R 2 0.385125
Standard error 11.86411
Observations 16
Durbin-Watson statistic 2.22
ANOVA
df SS MS F Significance F
Regression 3 1744.711214 581.5704046 4.131728 0.031554
Residual 12 1689.086161 140.7571801
Total 15 3433.797375