
Page 373 - Six Sigma Demystified
P. 373
Part 3 S i x S i g m a To o l S 353
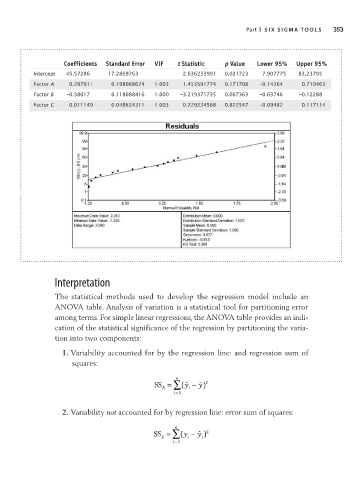
Coefficients Standard Error VIF t Statistic p Value Lower 95% Upper 95%
Intercept 45.57286 17.2869763 2.636253991 0.021723 7.907775 83.23795
Factor A 0.287911 0.198068624 1.003 1.453591774 0.171708 –0.14364 0.719465
Factor B –0.38017 0.118088416 1.000 –3.219371735 0.007363 –0.63746 –0.12288
Factor C 0.011149 0.048634311 1.003 0.229234568 0.822547 –0.09482 0.117114
Interpretation
The statistical methods used to develop the regression model include an
ANOVA table. Analysis of variation is a statistical tool for partitioning error
among terms. For simple linear regressions, the ANOVA table provides an indi-
cation of the statistical significance of the regression by partitioning the varia-
tion into two components:
1. Variability accounted for by the regression line: and regression sum of
squares:
n
SS = ∑ ( ˆ y − y) 2
R 1
i =1
2. Variability not accounted for by regression line: error sum of squares:
n
y
SS = ∑ ( y − ˆ ) 2
E i 1
i =1