
Page 44 - Six Sigma Demystified
P. 44
Chapter 1 d e p loy m e n t s t r at e g y 25
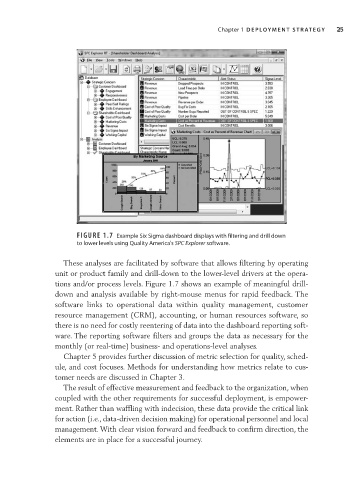
FIGURE 1.7 Example Six Sigma dashboard displays with filtering and drill down
to lower levels using Quality america's SPC Explorer software.
These analyses are facilitated by software that allows filtering by operating
unit or product family and drill- down to the lower- level drivers at the opera-
tions and/or process levels. Figure 1.7 shows an example of meaningful drill-
down and analysis available by right- mouse menus for rapid feedback. The
software links to operational data within quality management, customer
resource management (CRM), accounting, or human resources software, so
there is no need for costly reentering of data into the dashboard reporting soft-
ware. The reporting software filters and groups the data as necessary for the
monthly (or real- time) business- and operations- level analyses.
Chapter 5 provides further discussion of metric selection for quality, sched-
ule, and cost focuses. Methods for understanding how metrics relate to cus-
tomer needs are discussed in Chapter 3.
The result of effective measurement and feedback to the organization, when
coupled with the other requirements for successful deployment, is empower-
ment. Rather than waffling with indecision, these data provide the critical link
for action (i.e., data- driven decision making) for operational personnel and local
management. With clear vision forward and feedback to confirm direction, the
elements are in place for a successful journey.