Page 295 - Social Marketing for Public Health Global Trends and Success Stories
P. 295

57977_CH11_final.qxd:Cheng  11/5/09  4:44 PM  Page 268


                268    CHAPTER 11  ■ Socialism Meets Social Marketing


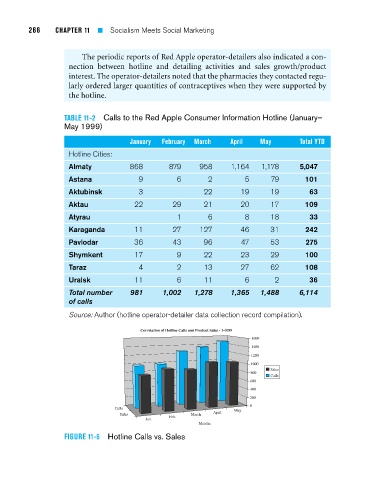
                              The periodic reports of Red Apple operator-detailers also indicated a con-
                           nection between hotline and detailing activities and sales growth/product
                           interest. The operator-detailers noted that the pharmacies they contacted regu-
                           larly ordered larger quantities of contraceptives when they were supported by
                           the hotline.


                          TABLE 11-2 Calls to the Red Apple Consumer Information Hotline (January–
                          May 1999)

                                           January  February  March   April    May       Total YTD
                           Hotline Cities:
                           Almaty          868        879     958      1,164   1,178     5,047
                           Astana             9         6       2         5      79        101
                           Aktubinsk          3                22        19      19         63
                           Aktau             22        29      21        20      17        109

                           Atyrau                       1       6         8      18         33
                           Karaganda         11        27     127        46      31        242
                           Pavlodar          36        43      96        47      53        275
                           Shymkent          17         9      22        23      29        100
                           Taraz              4         2      13        27      62        108
                           Uralsk            11         6      11         6       2         36
                           Total number    981      1,002    1,278     1,365   1,488     6,114
                           of calls
                           Source: Author (hotline operator-detailer data collection record compilation).

                                              Correlation of Hotline Calls and Product Sales - 1–5/99
                                                                            1600
                                                                            1400
                                                                            1200
                                                                            1000
                                                                                 Sales
                                                                            800
                                                                                 Calls
                                                                            600
                                                                            400
                                                                            200
                                                                            0
                                       Calls                            May
                                                                  April
                                         Sales              March
                                                      Feb.
                                                Jan.
                                                              Months
                          FIGURE 11-6 Hotline Calls vs. Sales
   290   291   292   293   294   295   296   297   298   299   300