
Page 96 - Socially Intelligent Agents Creating Relationships with Computers and Robots
P. 96
Emotion Recognition Agents for Speech Signal 79
ing emotional states: happiness, anger, sadness, fear and normal (unemotional)
state. Five subjects recorded the sentences twice with different recording pa-
rameters. Thus, each subject recorded 20 or 40 utterances, yielding a corpus
1
of 700 utterances , with 140 utterances per emotional state.
3.2 People Performance And Data Selection
We designed an experiment to answer the following questions: How well
can people without special training portray and recognize emotions in speech?
Which kinds of emotions are easier/harder to recognize?
We implemented an interactive program that selected and played back the
utterances in random order and allowed a user to classify each utterance ac-
cording to its emotional content. Twenty-three subjects took part in the eval-
uation stage, twenty of whom had participated in the recording stage earlier.
2
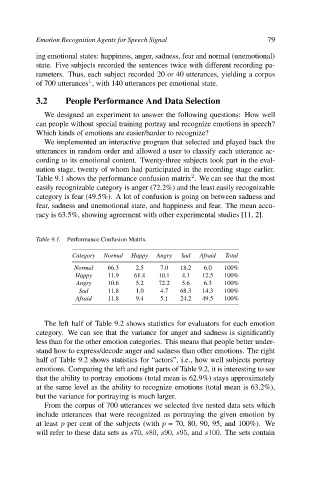
Table 9.1 shows the performance confusion matrix . We can see that the most
easily recognizable category is anger (72.2%) and the least easily recognizable
category is fear (49.5%). A lot of confusion is going on between sadness and
fear, sadness and unemotional state, and happiness and fear. The mean accu-
racy is 63.5%, showing agreement with other experimental studies [11, 2].
Table 9.1. Performance Confusion Matrix.
Category Normal Happy Angry Sad Afraid Total
Normal 66.3 2.5 7.0 18.2 6.0 100%
Happy 11.9 61.4 10.1 4.1 12.5 100%
Angry 10.6 5.2 72.2 5.6 6.3 100%
Sad 11.8 1.0 4.7 68.3 14.3 100%
Afraid 11.8 9.4 5.1 24.2 49.5 100%
The left half of Table 9.2 shows statistics for evaluators for each emotion
category. We can see that the variance for anger and sadness is significantly
less than for the other emotion categories. This means that people better under-
stand how to express/decode anger and sadness than other emotions. The right
half of Table 9.2 shows statistics for “actors”, i.e., how well subjects portray
emotions. Comparing the left and right parts of Table 9.2, it is interesting to see
that the ability to portray emotions (total mean is 62.9%) stays approximately
at the same level as the ability to recognize emotions (total mean is 63.2%),
but the variance for portraying is much larger.
From the corpus of 700 utterances we selected five nested data sets which
include utterances that were recognized as portraying the given emotion by
at least p per cent of the subjects (with p = 70, 80, 90, 95, and 100%). We
will refer to these data sets as s70, s80, s90, s95,and s100. The sets contain