
Page 97 - Socially Intelligent Agents Creating Relationships with Computers and Robots
P. 97
80 Socially Intelligent Agents
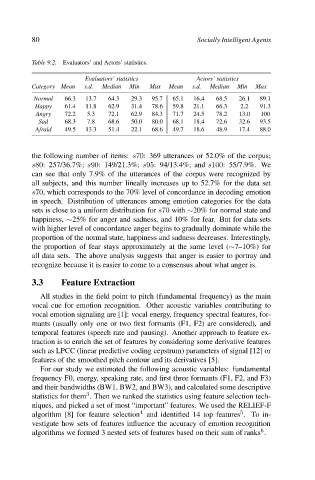
Table 9.2. Evaluators’ and Actors’ statistics.
Evaluators’ statistics Actors’ statistics
Category Mean s.d. Median Min Max Mean s.d. Median Min Max
Normal 66.3 13.7 64.3 29.3 95.7 65.1 16.4 68.5 26.1 89.1
Happy 61.4 11.8 62.9 31.4 78.6 59.8 21.1 66.3 2.2 91.3
Angry 72.2 5.3 72.1 62.9 84.3 71.7 24.5 78.2 13.0 100
Sad 68.3 7.8 68.6 50.0 80.0 68.1 18.4 72.6 32.6 93.5
Afraid 49.5 13.3 51.4 22.1 68.6 49.7 18.6 48.9 17.4 88.0
the following number of items: s70: 369 utterances or 52.0% of the corpus;
s80: 257/36.7%; s90: 149/21.3%; s95: 94/13.4%; and s100: 55/7.9%. We
can see that only 7.9% of the utterances of the corpus were recognized by
all subjects, and this number lineally increases up to 52.7% for the data set
s70, which corresponds to the 70% level of concordance in decoding emotion
in speech. Distribution of utterances among emotion categories for the data
sets is close to a uniform distribution for s70 with ∼20% for normal state and
happiness, ∼25% for anger and sadness, and 10% for fear. But for data sets
with higher level of concordance anger begins to gradually dominate while the
proportion of the normal state, happiness and sadness decreases. Interestingly,
the proportion of fear stays approximately at the same level (∼7–10%) for
all data sets. The above analysis suggests that anger is easier to portray and
recognize because it is easier to come to a consensus about what anger is.
3.3 Feature Extraction
All studies in the field point to pitch (fundamental frequency) as the main
vocal cue for emotion recognition. Other acoustic variables contributing to
vocal emotion signaling are [1]: vocal energy, frequency spectral features, for-
mants (usually only one or two first formants (F1, F2) are considered), and
temporal features (speech rate and pausing). Another approach to feature ex-
traction is to enrich the set of features by considering some derivative features
such as LPCC (linear predictive coding cepstrum) parameters of signal [12] or
features of the smoothed pitch contour and its derivatives [5].
For our study we estimated the following acoustic variables: fundamental
frequency F0, energy, speaking rate, and first three formants (F1, F2, and F3)
and their bandwidths (BW1, BW2, and BW3), and calculated some descriptive
3
statistics for them . Then we ranked the statistics using feature selection tech-
niques, and picked a set of most “important” features. We used the RELIEF-F
5
4
algorithm [8] for feature selection and identified 14 top features .To in-
vestigate how sets of features influence the accuracy of emotion recognition
6
algorithms we formed 3 nested sets of features based on their sum of ranks .