
Page 177 -
P. 177
160 Chapter 6 Architectural design
UML Code
Editors Generators
Java
Editor
Design Project
Translator Repository
Python
Editor
Design Report
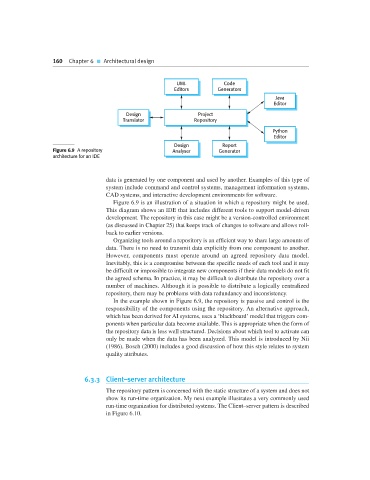
Figure 6.9 A repository Analyser Generator
architecture for an IDE
data is generated by one component and used by another. Examples of this type of
system include command and control systems, management information systems,
CAD systems, and interactive development environments for software.
Figure 6.9 is an illustration of a situation in which a repository might be used.
This diagram shows an IDE that includes different tools to support model-driven
development. The repository in this case might be a version-controlled environment
(as discussed in Chapter 25) that keeps track of changes to software and allows roll-
back to earlier versions.
Organizing tools around a repository is an efficient way to share large amounts of
data. There is no need to transmit data explicitly from one component to another.
However, components must operate around an agreed repository data model.
Inevitably, this is a compromise between the specific needs of each tool and it may
be difficult or impossible to integrate new components if their data models do not fit
the agreed schema. In practice, it may be difficult to distribute the repository over a
number of machines. Although it is possible to distribute a logically centralized
repository, there may be problems with data redundancy and inconsistency.
In the example shown in Figure 6.9, the repository is passive and control is the
responsibility of the components using the repository. An alternative approach,
which has been derived for AI systems, uses a ‘blackboard’ model that triggers com-
ponents when particular data become available. This is appropriate when the form of
the repository data is less well structured. Decisions about which tool to activate can
only be made when the data has been analyzed. This model is introduced by Nii
(1986). Bosch (2000) includes a good discussion of how this style relates to system
quality attributes.
6.3.3 Client–server architecture
The repository pattern is concerned with the static structure of a system and does not
show its run-time organization. My next example illustrates a very commonly used
run-time organization for distributed systems. The Client–server pattern is described
in Figure 6.10.