
Page 115 -
P. 115
86 PART TWO MANAGING SOFTWARE PROJECTS
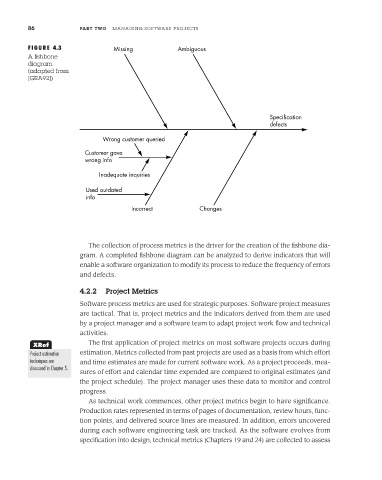
FIGURE 4.3 Missing Ambiguous
A fishbone
diagram
(adapted from
[GRA92])
Specification
defects
Wrong customer queried
Customer gave
wrong info
Inadequate inquiries
Used outdated
info
Incorrect Changes
The collection of process metrics is the driver for the creation of the fishbone dia-
gram. A completed fishbone diagram can be analyzed to derive indicators that will
enable a software organization to modify its process to reduce the frequency of errors
and defects.
4.2.2 Project Metrics
Software process metrics are used for strategic purposes. Software project measures
are tactical. That is, project metrics and the indicators derived from them are used
by a project manager and a software team to adapt project work flow and technical
activities.
XRef The first application of project metrics on most software projects occurs during
Project estimation estimation. Metrics collected from past projects are used as a basis from which effort
techniques are and time estimates are made for current software work. As a project proceeds, mea-
discussed in Chapter 5.
sures of effort and calendar time expended are compared to original estimates (and
the project schedule). The project manager uses these data to monitor and control
progress.
As technical work commences, other project metrics begin to have significance.
Production rates represented in terms of pages of documentation, review hours, func-
tion points, and delivered source lines are measured. In addition, errors uncovered
during each software engineering task are tracked. As the software evolves from
specification into design, technical metrics (Chapters 19 and 24) are collected to assess