
Page 130 -
P. 130
CHAPTER 4 SOFTWARE PROCESS AND PROJECT METRICS 101
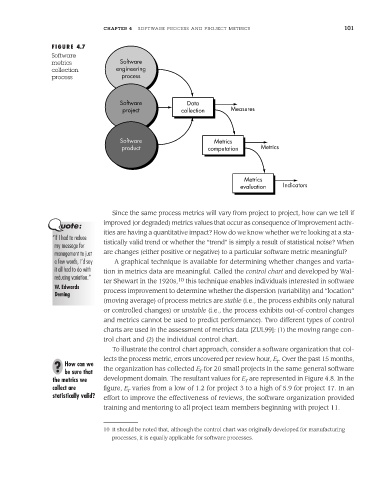
FIGURE 4.7
Software
metrics Software
collection engineering
process process
Software Data
project collection Measures
Software Metrics
product computation Metrics
Metrics
evaluation Indicators
Since the same process metrics will vary from project to project, how can we tell if
improved (or degraded) metrics values that occur as consequence of improvement activ-
ities are having a quantitative impact? How do we know whether we’re looking at a sta-
“If I had to reduce
my message for tistically valid trend or whether the “trend” is simply a result of statistical noise? When
management to just are changes (either positive or negative) to a particular software metric meaningful?
a few words, I’d say A graphical technique is available for determining whether changes and varia-
it all had to do with tion in metrics data are meaningful. Called the control chart and developed by Wal-
reducing variation.”
ter Shewart in the 1920s, 10 this technique enables individuals interested in software
W. Edwards process improvement to determine whether the dispersion (variability) and “location”
Deming
(moving average) of process metrics are stable (i.e., the process exhibits only natural
or controlled changes) or unstable (i.e., the process exhibits out-of-control changes
and metrics cannot be used to predict performance). Two different types of control
charts are used in the assessment of metrics data [ZUL99]: (1) the moving range con-
trol chart and (2) the individual control chart.
To illustrate the control chart approach, consider a software organization that col-
lects the process metric, errors uncovered per review hour, E . Over the past 15 months,
r
? How can we the organization has collected E for 20 small projects in the same general software
r
be sure that
the metrics we development domain. The resultant values for E are represented in Figure 4.8. In the
r
collect are figure, E varies from a low of 1.2 for project 3 to a high of 5.9 for project 17. In an
r
statistically valid? effort to improve the effectiveness of reviews, the software organization provided
training and mentoring to all project team members beginning with project 11.
10 It should be noted that, although the control chart was originally developed for manufacturing
processes, it is equally applicable for software processes.