Page 132 -
P. 132

CHAPTER 4  SOFTWARE PROCESS AND PROJECT METRICS                    103

               FIGURE 4.9           4
                               Differences in successive  E r  values  2.5
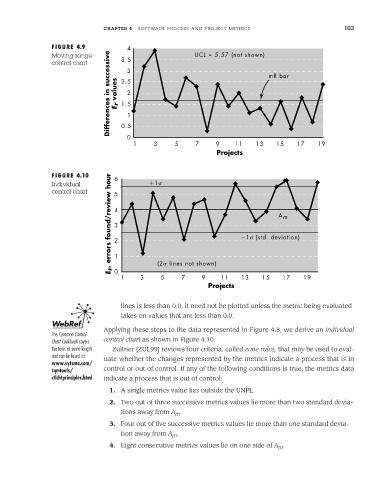
               Moving range                            UCL = 5.57 (not shown)
               control chart       3.5                                      mR bar
                                    3


                                    2
                                   1.5
                                    1
                                   0.5
                                    0
                                      1     3     5    7     9    11    13    15   17    19
                                                             Projects


               FIGURE 4.10       6
                                E r , errors found/review hour  4    1  (std. deviation)
               Individual                  1
               control chart     5


                                                                              A
                                                                                m
                                 3
                                 2

                                 1

                                 0
                                   1    3    (2  lines not shown)  11  13  15  17    19
                                              5
                                                   7
                                                         9
                                                           Projects
                                   lines is less than 0.0, it need not be plotted unless the metric being evaluated
                                   takes on values that are less than 0.0.
               WebRef
                              Applying these steps to the data represented in Figure 4.8, we derive an individual
               The Common Control
               Chart Cookbook covers  control chart as shown in Figure 4.10.
               the topic at some length  Zultner [ZUL99] reviews four criteria, called zone rules, that may be used to eval-
               and can be found at  uate whether the changes represented by the metrics indicate a process that is in
               www.sytsma.com/
               tqmtools/      control or out of control. If any of the following conditions is true, the metrics data
               ctlchtprinciples.html  indicate a process that is out of control:
                               1. A single metrics value lies outside the UNPL.
                               2. Two out of three successive metrics values lie more than two standard devia-
                                   tions away from A .
                                                  m
                               3. Four out of five successive metrics values lie more than one standard devia-
                                   tion away from A .
                                                 m
                               4. Eight consecutive metrics values lie on one side of A .
                                                                              m
   127   128   129   130   131   132   133   134   135   136   137