
Page 220 -
P. 220
CHAPTER 7 PROJECT SCHEDULING AND TRACKING 191
a. Define parallel work activities during the OLCRS project.
b. Distribute effort throughout the project.
c. Establish milestones for the project.
7.8. Using Section 7.3 as a guide compute the TSS for OLCRS. Be sure to show all
of your work. Select a project type and an appropriate task set for the project.
7.9. Define a task network for OLCRS, or alternatively, for another software project
that interests you. Be sure to show tasks and milestones and to attach effort and dura-
tion estimates to each task. If possible, use an automated scheduling tool to perform
this work.
7.10. If an automated scheduling tool is available, determine the critical path for the
network defined in problem 7.7.
7.11. Using a scheduling tool (if available) or paper and pencil (if necessary), develop
a timeline chart for the OLCRS project.
7.12. Refine the task called “technology risk assessment” in Section 7.4 in much the
same way as concept scoping was refined in Section 7.5.
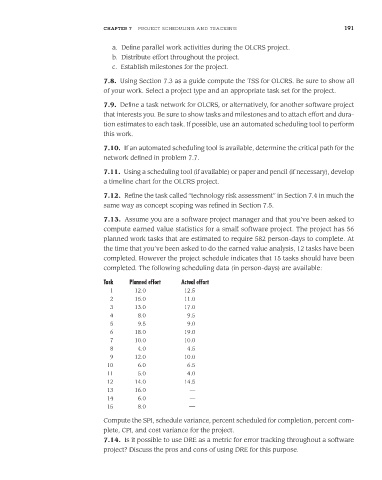
7.13. Assume you are a software project manager and that you’ve been asked to
compute earned value statistics for a small software project. The project has 56
planned work tasks that are estimated to require 582 person-days to complete. At
the time that you’ve been asked to do the earned value analysis, 12 tasks have been
completed. However the project schedule indicates that 15 tasks should have been
completed. The following scheduling data (in person-days) are available:
Task Planned effort Actual effort
1 12.0 12.5
2 15.0 11.0
3 13.0 17.0
4 8.0 9.5
5 9.5 9.0
6 18.0 19.0
7 10.0 10.0
8 4.0 4.5
9 12.0 10.0
10 6.0 6.5
11 5.0 4.0
12 14.0 14.5
13 16.0 —
14 6.0 —
15 8.0 —
Compute the SPI, schedule variance, percent scheduled for completion, percent com-
plete, CPI, and cost variance for the project.
7.14. Is it possible to use DRE as a metric for error tracking throughout a software
project? Discuss the pros and cons of using DRE for this purpose.