
Page 300 - Soil and water contamination, 2nd edition
P. 300
Patterns in the soil and in the vadose zone 287
b.
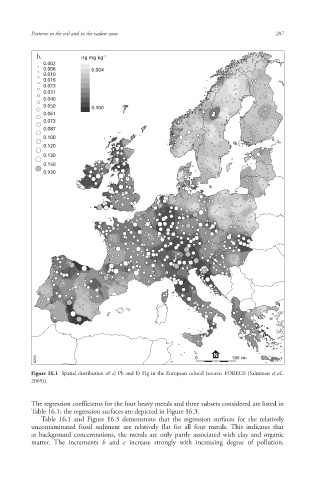
Figure 16.1 Spatial distribution of a) Pb and b) Hg in the European subsoil (source: FOREGS (Salminen et al.,
2005)).
The regression coefficients for the four heavy metals and three subsets considered are listed in
Table 16.1; the regression surfaces are depicted in Figure 16.3.
Table 16.1 and Figure 16.3 demonstrate that the regression surfaces for the relatively
uncontaminated fossil sediment are relatively flat for all four metals. This indicates that
at background concentrations, the metals are only partly associated with clay and organic
matter. The increments b and c increase strongly with increasing degree of pollution,
10/1/2013 6:45:27 PM
Soil and Water.indd 299 10/1/2013 6:45:27 PM
Soil and Water.indd 299