
Page 302 - Soil and water contamination, 2nd edition
P. 302
Patterns in the soil and in the vadose zone 289
implying a strong sorption of the enriched metals by clay and organic matter. The
coefficients related to organic matter increase more than the coefficients for clay, particularly
for Pb , implying that in unpolluted sediments, metals are more associated with the mineral
fraction from which they are released by weathering. In polluted sediments, metal ions
adsorb to organic matter more than in unpolluted sediments. However, this does not
necessarily mean that metals bond preferentially to organic matter. The way metals are
released into the fluvial environment may also have determined the relationships in the
sediments (Förstner and Wittman, 1983). In the case of these polluted overbank deposits,
the metals have mainly been derived from discharges from wastewater treatment plants
and industrial outfalls in upstream parts of the catchments (Vink and Behrendt, 2002).
During transport by the river water, the metals can readily partition between the river water
solution and the suspended matter that consists both of mineral components and organic
matter. The reason that the metals seem to prefer the organic matter in polluted sediments
rather than in unpolluted sediments (in which the metal ions originate principally from the
mineral fraction) could be that the polluted mineral and organic suspended matter have been
deposited concurrently on the floodplain .
As noted above, the spatial variation in particle size distribution and organic matter
content of soils may dominate the patterns of contaminants in soil. This source of variation
may largely obscure regional trends of soil contamination from other sources. The effect
of variations of clay and organic matter content can be filtered out by standardising the
contaminant concentrations to a standardised soil or sediment with a given clay and organic
matter content. Equation (16.3) can be used to standardise the concentrations to a standard
soil with given percentages of clay and organic matter. The concentration in the standard
sediment can be obtained by calculating (see Van der Perk and Van Gaans, 1997):
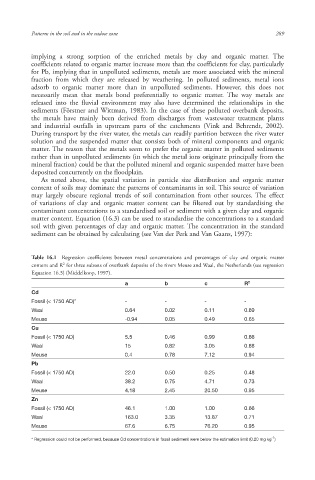
Table 16.1 Regression coefficients between metal concentrations and percentages of clay and organic matter
2
content and R for three subsets of overbank deposits of the rivers Meuse and Waal, the Netherlands (see regression
Equation 16.3) (Middelkoop, 1997).
a b c R 2
Cd
Fossil (< 1750 AD)* - - - -
Waal 0.64 0.02 0.11 0.69
Meuse -0.94 0.05 0.49 0.65
Cu
Fossil (< 1750 AD) 5.5 0.46 0.99 0.66
Waal 15 0.82 3.05 0.88
Meuse 0.4 0.78 7.12 0.94
Pb
Fossil (< 1750 AD) 22.0 0.50 0.25 0.48
Waal 38.2 0.75 4.71 0.73
Meuse 4.18 2.45 20.50 0.95
Zn
Fossil (< 1750 AD) 46.1 1.00 1.00 0.66
Waal 163.0 3.35 13.87 0.71
Meuse 67.6 6.75 76.20 0.95
-1
* Regression could not be performed, because Cd concentrations in fossil sediment were below the estimation limit (0.20 mg kg )
10/1/2013 6:45:30 PM
Soil and Water.indd 301
Soil and Water.indd 301 10/1/2013 6:45:30 PM