
Page 306 - Soil and water contamination, 2nd edition
P. 306
Patterns in the soil and in the vadose zone 293
but also on agricultural land. For example, in England and Wales, atmospheric inputs
to agricultural soils account for 49% of the total annual Zn input, 39% of the total Cu
input, 78% of the total Pb input, and 53% of the total Cd input (Ferguson et al., 2003).
Atmospheric deposition onto soils varies over a broad range of spatial scales and depends on
the proximity to the source, precipitation, and landscape structure. The relation to distance
to the pollution source can be exemplified by the spatial distribution of 137 Cs deposition
onto soil following the Chernobyl accident in Ukraine, April 1986 and the Fukushima
nuclear accident in Japan, March 2011 (see Figures 8.3 and 8.4, respectively). The areas
most affected by the Chernobyl accident were Ukraine, Belarus, and the European part
of Russia (see Figure 8.3). Two factors influenced the patterns of continental deposition
of 137 Cs farther away from Chernobyl. The first was the atmospheric circulation patterns
during and immediately after the accident. The second was the incidence of local rainstorms
which flushed the radioactive dust from the atmosphere to settle on vegetation and soil as
the radioactive cloud passed overhead. The Chernobyl accident released radioactivity over a
relatively short period of time: about ten days. The first day accounted for about 25 percent
of the total radioactive emission . But it has also been shown that supra-regional deposition
137
patterns of previous bomb-derived Cs associated with the testing of nuclear weapons ,
which occurred during a much longer time span in the late 1950s and 1960s, are determined
by annual rainfall (Basher and Mathews, 1993; Owens and Walling, 1996; Bernard et al.,
1998).
Prolonged releases from point source s of atmospheric pollutants also result in
atmospheric deposition tending to decrease with increasing distance from the pollution
source. However, the resulting pattern is usually smoother compared with momentary
releases, because it is comprised of a superposition of patterns developed under various
atmospheric conditions of wind direction, wind speed, and precipitation rates. Nevertheless,
the resulting pattern often clearly reflects the prevailing wind directions. For example, in
the USA, many power plants are located in the Midwest, and here and throughout the east
coast, acid deposition derived from SO emissions from these power plants is common.
2
Likewise, large areas of Scandinavia, Central and Eastern Europe, and parts of China have
been adversely affected by deposition of acidifying components originating from upwind
emissions.
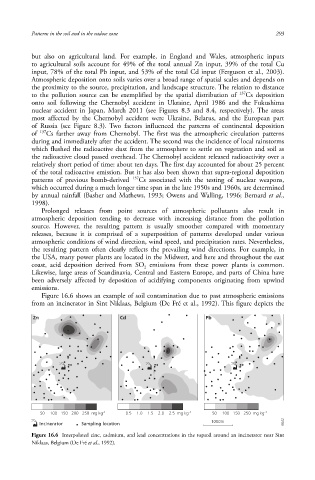
Figure 16.6 shows an example of soil contamination due to past atmospheric emissions
from an incinerator in Sint Niklaas, Belgium (De Fré et al., 1992). This figure depicts the
Zn Cd Pb
50 100 150 200 250 mg kg -1 0.5 1.0 1.5 2.0 2.5 mg kg -1 50 100 150 250 mg kg -1
1000m
Incinerator Sampling location 6642 6642 6642
Figure 16.6 Interpolated zinc, cadmium, and lead concentrations in the topsoil around an incinerator near Sint
Niklaas, Belgium (De Fré et al., 1992).
10/3/2013 2:37:58 PM
Soil and Water.indd 305 10/3/2013 2:37:58 PM
Soil and Water.indd 305