
Page 308 - Soil and water contamination, 2nd edition
P. 308
Patterns in the soil and in the vadose zone 295
SO 4 2- 3500 SO 4 2- A
Net throughfall flux eq ha -1 y -1 3500 Net throughfall flux eq ha -1 y -1 2500 D
B
3000
3000
C
2500
E
2000
2000
F
1500
1500
G
H
1000
1000
500
0 500 0
0 2 4 6 8 10 12 0 2 4 6 8 10 12
NO - x/h NO - x/h
1000 3 1000 3
Net throughfall flux eq ha -1 y -1 600 Net throughfall flux eq ha -1 y -1 600
800
800
400
400
200
0 200 0
0 2 4 6 8 10 12 0 2 4 6 8 10 12
x/h x/h
NH + NH +
4000 4 4000 4
Net throughfall flux eq ha -1 y -1 2400 Net throughfall flux eq ha -1 y -1 2400
3200
3200
1600
1600
800
0 800 0
0 2 4 6 8 10 12 0 2 4 6 8 10 12
x/h x/h
Na + Na +
5000 2500
Net throughfall flux eq ha -1 y -1 3000 Net throughfall flux eq ha -1 y -1 1500
2000
4000
1000
2000
1000
0 500 0
0 2 4 6 8 10 12 0 2 4 6 8 10 12
x/h x/h
Cl - Cl -
6000 3500
Net throughfall flux eq ha -1 y -1 4000 Net throughfall flux eq ha -1 y -1 2000
3000
5000
250
0
3000
1500
2000
1000
1000
0 500 0 6955
0 2 4 6 8 10 12 0 2 4 6 8 10 12
x/h x/h
+
-
2-
-
+
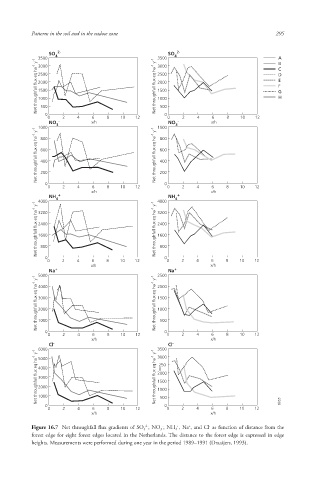
Figure 16.7 Net throughfall flux gradients of SO 4 , NO 3 , NH 4 , Na , and Cl as function of distance from the
forest edge for eight forest edges located in the Netherlands. The distance to the forest edge is expressed in edge
heights. Measurements were performed during one year in the period 1989–1991 (Draaijers, 1993).
10/1/2013 6:45:31 PM
Soil and Water.indd 307 10/1/2013 6:45:31 PM
Soil and Water.indd 307