
Page 312 - Soil and water contamination, 2nd edition
P. 312
Patterns in the soil and in the vadose zone 299
Q-Rhine Q-Rhine
7200 m 3 s -1 8700 m 3 s -1
WAAL WAAL
2.0 m s -1 0 1000 m
Q-Rhine
9470 m 3 s -1 0.7
0.6
0.5
0.4
0.3
WAAL 0.2
0.1
0.0
flow line
6642 6642 6642
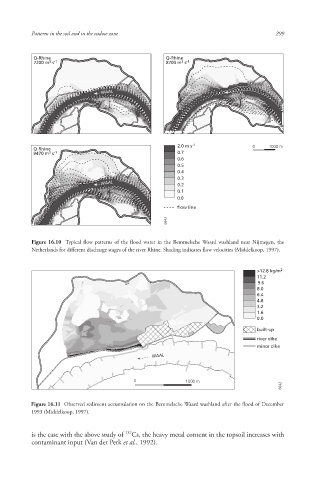
Figure 16.10 Typical flow patterns of the flood water in the Bemmelsche Waard washland near Nijmegen, the
Netherlands for different discharge stages of the river Rhine . Shading indicates flow velocities (Middelkoop, 1997).
>12.8 kg/m 2
11.2
9.6
8.0
6.4
4.8
3.2
1.6
0.0
built-up
river dike
minor dike
WAAL
0 1000 m
6642 6642 6642
Figure 16.11 Observed sediment accumulation on the Bemmelsche Waard washland after the flood of December
1993 (Middelkoop, 1997).
137
is the case with the above study of Cs, the heavy metal content in the topsoil increases with
contaminant input (Van der Perk et al., 1992).
10/1/2013 6:45:32 PM
Soil and Water.indd 311
Soil and Water.indd 311 10/1/2013 6:45:32 PM