
Page 315 - Soil and water contamination, 2nd edition
P. 315
302 Soil and Water Contamination
0
70
10
20 Precipitation (mm)
60
30
50
Br concentration (mg l -1 ) 40
30
20
10
6642 6642 6642
0 50 100 150
Days after Br application
precipitation individual measurements mean
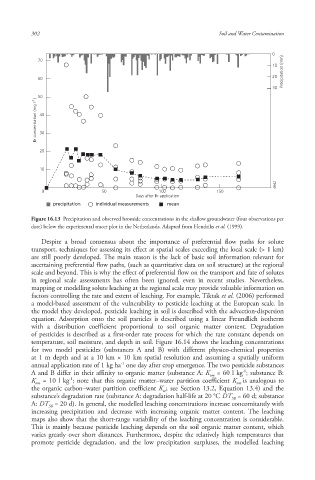
Figure 16.13 Precipitation and observed bromide concentrations in the shallow groundwater (four observations per
date) below the experimental tracer plot in the Netherlands. Adapted from Hendriks et al. (1999).
Despite a broad consensus about the importance of preferential flow paths for solute
transport, techniques for assessing its effect at spatial scales exceeding the local scale (> 1 km)
are still poorly developed. The main reason is the lack of basic soil information relevant for
ascertaining preferential flow paths, (such as quantitative data on soil structure) at the regional
scale and beyond. This is why the effect of preferential flow on the transport and fate of solutes
in regional scale assessments has often been ignored, even in recent studies. Nevertheless,
mapping or modelling solute leaching at the regional scale may provide valuable information on
factors controlling the rate and extent of leaching. For example, Tiktak et al. (2006) performed
a model-based assessment of the vulnerability to pesticide leaching at the European scale. In
the model they developed, pesticide leaching in soil is described with the advection-dispersion
equation. Adsorption onto the soil particles is described using a linear Freundlich isotherm
with a distribution coefficient proportional to soil organic matter content. Degradation
of pesticides is described as a first-order rate process for which the rate constant depends on
temperature, soil moisture, and depth in soil. Figure 16.14 shows the leaching concentrations
for two model pesticides (substances A and B) with different physico-chemical properties
at 1 m depth and at a 10 km × 10 km spatial resolution and assuming a spatially uniform
-1
annual application rate of 1 kg ha one day after crop emergence. The two pesticide substances
-1
A and B differ in their affinity to organic matter (substance A: K = 60 l kg ; substance B:
om
-1
K = 10 l kg ; note that this organic matter–water partition coefficient K is analogous to
om om
the organic carbon–water partition coefficient K ; see Section 13.2, Equation 13.4) and the
oc
substance’s degradation rate (substance A: degradation half-life at 20 °C DT = 60 d; substance
50
A: DT = 20 d). In general, the modelled leaching concentrations increase concomitantly with
50
increasing precipitation and decrease with increasing organic matter content. The leaching
maps also show that the short-range variability of the leaching concentration is considerable.
This is mainly because pesticide leaching depends on the soil organic matter content, which
varies greatly over short distances. Furthermore, despite the relatively high temperatures that
promote pesticide degradation, and the low precipitation surpluses, the modelled leaching
10/1/2013 6:45:32 PM
Soil and Water.indd 314 10/1/2013 6:45:32 PM
Soil and Water.indd 314