
Page 318 - Soil and water contamination, 2nd edition
P. 318
Patterns in the soil and in the vadose zone 305
W E
14 HU-3 HU-2 HU-1
Nederrijn
m + O.D. 12
10
8
0 250 m
6
channel deposits
heavy metal profie
overbank deposits Cu
minor river dike
residual channel deposits Pb
water Zn
HU-3 HU-2 HU-1
metal concentration (mg/kg metal concentration (mg/kg metal concentration (mg/kg)
0 500 1000 1500 0 500 1000 1500 0 500 1000 1500
20 20 20
40 40 40
60 60 60
80 80 80
100 100 100
120 120 120
140 140 140
160 160 160
180 180 180
6642 6642 6642
200 200 200
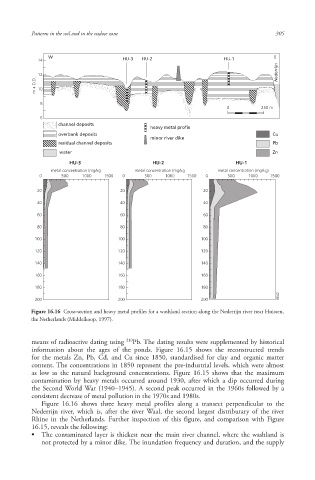
Figure 16.16 Cross-section and heavy metal profiles for a washland section along the Nederrijn river near Huissen,
the Netherlands (Middelkoop, 1997).
210
means of radioactive dating using Pb. The dating results were supplemented by historical
information about the ages of the ponds. Figure 16.15 shows the reconstructed trends
for the metals Zn , Pb , Cd , and Cu since 1850, standardised for clay and organic matter
content . The concentrations in 1850 represent the pre-industrial levels, which were almost
as low as the natural background concentration s. Figure 16.15 shows that the maximum
contamination by heavy metals occurred around 1930, after which a dip occurred during
the Second World War (1940–1945). A second peak occurred in the 1960s followed by a
consistent decrease of metal pollution in the 1970s and 1980s.
Figure 16.16 shows three heavy metal profiles along a transect perpendicular to the
Nederrijn river, which is, after the river Waal, the second largest distributary of the river
Rhine in the Netherlands. Further inspection of this figure, and comparison with Figure
16.15, reveals the following:
• The contaminated layer is thickest near the main river channel, where the washland is
not protected by a minor dike. The inundation frequency and duration, and the supply
10/1/2013 6:45:35 PM
Soil and Water.indd 317
Soil and Water.indd 317 10/1/2013 6:45:35 PM