
Page 314 - Soil and water contamination, 2nd edition
P. 314
Patterns in the soil and in the vadose zone 301
0 0
6642 6642 6642
Depth (cm) 50 Depth (cm) 50
100 100
0 50 100 150 0 50 100 150
Br concentration (mg l -1 ) Br concentration (mg l -1 )
0 0
Depth (cm) 50 Depth (cm) 50
100 100
0 50 100 150 0 50 100 150
Br concentration (mg l -1 ) Br concentration (mg l -1 )
0 0
Depth (cm) 50 Depth (cm) 50
100 100
0 50 100 150 0 50 100 150
Br concentration (mg l -1 ) Br concentration (mg l -1 )
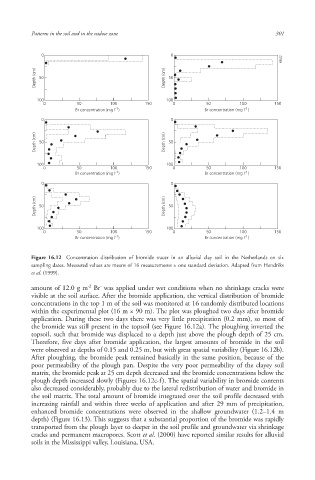
Figure 16.12 Concentration distribution of bromide tracer in an alluvial clay soil in the Netherlands on six
sampling dates. Measured values are means of 16 measurements ± one standard deviation. Adapted from Hendriks
et al. (1999).
-2
-
amount of 12.0 g m Br was applied under wet conditions when no shrinkage cracks were
visible at the soil surface. After the bromide application, the vertical distribution of bromide
concentrations in the top 1 m of the soil was monitored at 16 randomly distributed locations
within the experimental plot (16 m × 90 m). The plot was ploughed two days after bromide
application. During these two days there was very little precipitation (0.2 mm), so most of
the bromide was still present in the topsoil (see Figure 16.12a). The ploughing inverted the
topsoil, such that bromide was displaced to a depth just above the plough depth of 25 cm.
Therefore, five days after bromide application, the largest amounts of bromide in the soil
were observed at depths of 0.15 and 0.25 m, but with great spatial variability (Figure 16.12b).
After ploughing, the bromide peak remained basically in the same position, because of the
poor permeability of the plough pan. Despite the very poor permeability of the clayey soil
matrix, the bromide peak at 25 cm depth decreased and the bromide concentrations below the
plough depth increased slowly (Figures 16.12c-f). The spatial variability in bromide contents
also decreased considerably, probably due to the lateral redistribution of water and bromide in
the soil matrix. The total amount of bromide integrated over the soil profile decreased with
increasing rainfall and within three weeks of application and after 29 mm of precipitation,
enhanced bromide concentrations were observed in the shallow groundwater (1.2–1.4 m
depth) (Figure 16.13). This suggests that a substantial proportion of the bromide was rapidly
transported from the plough layer to deeper in the soil profile and groundwater via shrinkage
cracks and permanent macropores . Scott et al. (2000) have reported similar results for alluvial
soils in the Mississippi valley, Louisiana, USA.
10/1/2013 6:45:32 PM
Soil and Water.indd 313 10/1/2013 6:45:32 PM
Soil and Water.indd 313