Page 301 - Soil and water contamination, 2nd edition
P. 301

288                                                  Soil and Water Contamination

                                    Clay %                   Asmg kg -1               Zn mg kg -1
                                       22                       12.0                     110
                                       20                       11.2                     100
                                       18                       10.4                      90
                                       16                        9.6                      80
                                       14                        8.8                      70
                                       12                        8.0                      60
                                       10


                     6642  6642  6642

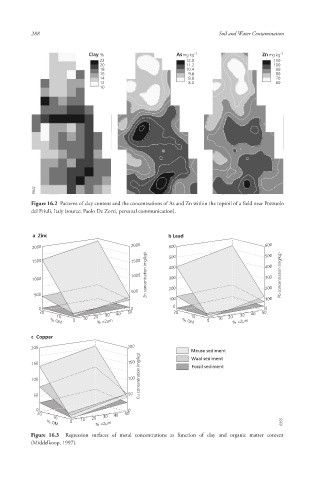
                    Figure 16.2  Patterns of clay content  and the concentrations of As and Zn  within the topsoil of a field near Pozzuolo
                    del Friuli, Italy (source: Paolo De Zorzi, personal communication).


                    a  Zinc                                b Lead
                    2000                        2000       600                         600
                                                     Zn concentration (mg/kg)              Pb concentration (mg/kg)
                    1500                        1500       500                         500
                                                                                       400
                                                           400
                                                1000
                    1000                                   300                         300
                                                500        200                         200
                     500
                                                           100                         100
                                                            0
                      0                         0                                      0
                      20                    40  50          20                    40  50
                           10      10  20  30                    10         20  30
                                0                                        10
                         % OM          % <2µm                  % OM   0      % <2µm
                    c  Copper
                    200                        200
                                                                 Meuse sediment
                                                   Cu concentration (mg/kg)
                    150                        150                Waal sediment
                                                                  Fossil sediment
                    100                        100

                     50                        50

                     0                          0
                      20                   40  50
                          10      10  20  30
                               0
                                      % <2µm
                        % OM                                                               6955
                    Figure 16.3   Regression surfaces of metal concentrations as function of clay and organic matter content
                    (Middelkoop, 1997).


                                                                                            10/1/2013   6:45:30 PM
        Soil and Water.indd   300                                                           10/1/2013   6:45:30 PM
        Soil and Water.indd   300
   296   297   298   299   300   301   302   303   304   305   306