
Page 345 - Soil and water contamination, 2nd edition
P. 345
332 Soil and Water Contamination
a NO (mg/l) b Fe (mg/l) c SO 2- (mg/l)
-
2+
3 4
0 20 40 60 80 100 0 2 4 6 8 10 12 14 16 0 20 40 60 80 100 120 140
5 10 5 10 5
10
Depth (m below surface) 15 Depth (m below surface) 15 Depth (m below surface) 15
20
20
20
25
30
30
30 25 25
6955
35 35 35
-
2-
2+
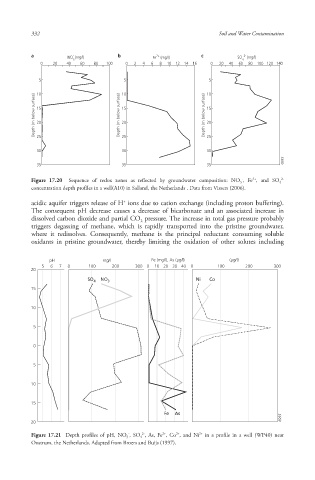
Figure 17.20 Sequence of redox zones as reflected by groundwater composition: NO 3 , Fe , and SO 4
concentration depth profiles in a well(A10) in Salland, the Netherlands . Data from Vissers (2006).
+
acidic aquifer triggers release of H ions due to cation exchange (including proton buffering ).
The consequent pH decrease causes a decrease of bicarbonate and an associated increase in
dissolved carbon dioxide and partial CO pressure. The increase in total gas pressure probably
2
triggers degassing of methane, which is rapidly transported into the pristine groundwater,
where it redissolves. Consequently, methane is the principal reductant consuming soluble
oxidants in pristine groundwater, thereby limiting the oxidation of other solutes including
pH mg/l Fe (mg/l), As (µg/l) (µg/l)
5 6 7 0 100 200 300 0 10 20 30 40 0 100 200 300
20
SO NO Ni Co
4 3
15
10
5
0
5
10
15
Fe As
6955
20
2+
-
2-
2+
2+
Figure 17.21 Depth profiles of pH , NO 3 , SO 4 , As, Fe , Co , and Ni in a profile in a well (WP40) near
Oostrum, the Netherlands. Adapted from Broers and Buijs (1997).
10/1/2013 6:47:09 PM
Soil and Water.indd 344
Soil and Water.indd 344 10/1/2013 6:47:09 PM