Page 416 - Soil and water contamination, 2nd edition
P. 416

Answers to exercises                                                  403

                   CHAPTER 15
                                                                  6
                       6
                   4.  4  = 1296 model runs for four model parameters; 6  = 46 656 model runs for six
                      parameters.
                          2
                   5. a.  R  = 0.918
                      b.  Nash efficiency coefficient = 0.868
                      c.  t = 0.988; t  = 2.069 for 23 degrees of freedom. Hence, we cannot reject the null
                                  0
                         hypothesis that the mean difference between the observed and predicted values differs
                         significantly from zero.


                   CHAPTER 16

                   2.  37.8 g m -2

                              -1
                   3.  382 mg kg ; the sample is more contaminated than the area average (Y  > Y ).
                                                                             m   r
                   4.  b.  0.30 mg kg -1
                      c.   1) samples from the topsoil and the deeper soil are of the same origin (same parent
                         material) and 2) the deeper soil is not contaminated.


                   CHAPTER 17

                   3.   1) Enhanced atmospheric deposition of acids and 2) oxidation of pyrite by agriculturally
                      derived nitrate.
                                               -1
                                                                            -1
                   4.  Forest: approximately 400 mm y ; heather: approximately 585 mm y .
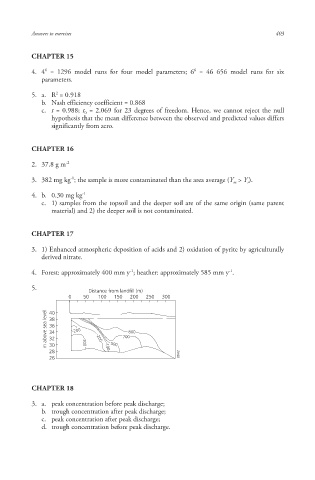
                   5.
                                    Distance from landfill (m)
                              0   50  100  150  200  250  300

                        m above sea level  38  -200  -200  700 800
                        40
                        36
                        34
                        32
                        30
                        28        -300  -100 500             6642  6642  6642
                        26


                   CHAPTER 18

                   3.  a.  peak concentration before peak discharge;
                      b.  trough concentration after peak discharge;
                      c.  peak concentration after peak discharge;
                      d.  trough concentration before peak discharge.


                                                                                            10/1/2013   6:47:54 PM
        Soil and Water.indd   415
        Soil and Water.indd   415                                                           10/1/2013   6:47:54 PM
   411   412   413   414   415   416   417   418   419