
Page 285 - Solar Power in Building Design The Engineer's Complete Design Resource
P. 285
252 ECONOMICS OF SOLAR POWER SYSTEMS
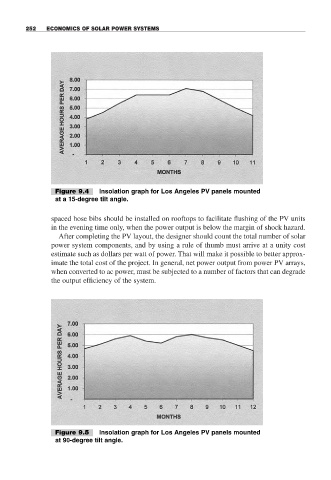
Figure 9.4 Insolation graph for Los Angeles PV panels mounted
at a 15-degree tilt angle.
spaced hose bibs should be installed on rooftops to facilitate flushing of the PV units
in the evening time only, when the power output is below the margin of shock hazard.
After completing the PV layout, the designer should count the total number of solar
power system components, and by using a rule of thumb must arrive at a unity cost
estimate such as dollars per watt of power. That will make it possible to better approx-
imate the total cost of the project. In general, net power output from power PV arrays,
when converted to ac power, must be subjected to a number of factors that can degrade
the output efficiency of the system.
Figure 9.5 Insolation graph for Los Angeles PV panels mounted
at 90-degree tilt angle.