
Page 123 - Solid Waste Analysis and Minimization a Systems Approach
P. 123
DEFINE 101
6.2 Define
The purpose of the define stage is to gather sufficient information to clarify the oppor-
tunity for improvement, learn about the process, learn about the organizations barriers to
solving the problem, and to develop a plan to address the problem. Common tools that
are used throughout the define stage are
■ Listening to customers
■ Kano model
■ Affinity diagram
■ Pareto analysis
■ Surveys
■ Gaining process knowledge
■ Process mapping
■ SIPOC analysis
■ Work studies
■ Sizing the problem
■ Force-field analysis
■ Developing project charter
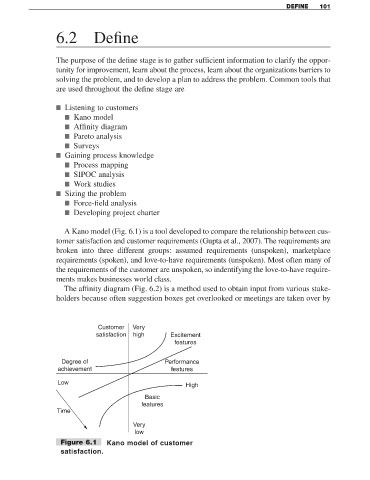
A Kano model (Fig. 6.1) is a tool developed to compare the relationship between cus-
tomer satisfaction and customer requirements (Gupta et al., 2007). The requirements are
broken into three different groups: assumed requirements (unspoken), marketplace
requirements (spoken), and love-to-have requirements (unspoken). Most often many of
the requirements of the customer are unspoken, so indentifying the love-to-have require-
ments makes businesses world class.
The affinity diagram (Fig. 6.2) is a method used to obtain input from various stake-
holders because often suggestion boxes get overlooked or meetings are taken over by
Customer Very
satisfaction high Excitement
features
Degree of Performance
achievement features
Low High
Basic
features
Time
Very
low
Figure 6.1 Kano model of customer
satisfaction.