
Page 125 - Solid Waste Analysis and Minimization a Systems Approach
P. 125
DEFINE 103
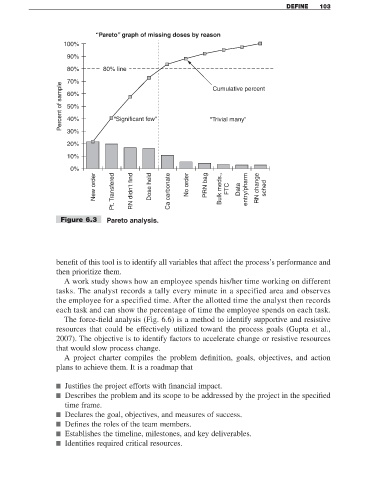
“Pareto” graph of missing doses by reason
100%
90%
80% 80% line
70% Cumulative percent
Percent of sample 60% “Significant few”
50%
40%
30% “Trivial many”
20%
10%
0%
New order Pt. Transfered RN didn’t find Dose held Ca carbonate No order PRN bag Bulk meds., FTC Data entry/pharm RN change sched
Figure 6.3 Pareto analysis.
benefit of this tool is to identify all variables that affect the process’s performance and
then prioritize them.
A work study shows how an employee spends his/her time working on different
tasks. The analyst records a tally every minute in a specified area and observes
the employee for a specified time. After the allotted time the analyst then records
each task and can show the percentage of time the employee spends on each task.
The force-field analysis (Fig. 6.6) is a method to identify supportive and resistive
resources that could be effectively utilized toward the process goals (Gupta et al.,
2007). The objective is to identify factors to accelerate change or resistive resources
that would slow process change.
A project charter compiles the problem definition, goals, objectives, and action
plans to achieve them. It is a roadmap that
■ Justifies the project efforts with financial impact.
■ Describes the problem and its scope to be addressed by the project in the specified
time frame.
■ Declares the goal, objectives, and measures of success.
■ Defines the roles of the team members.
■ Establishes the timeline, milestones, and key deliverables.
■ Identifies required critical resources.