
Page 124 - Solid Waste Analysis and Minimization a Systems Approach
P. 124
102 THE SIX SIGMA SYSTEMS APPROACH FOR DEPLOYMENT
Data
Header
Ideas
1
2 3 4
Data Diagram Work Work Diagram
Header Header
Ideas Ideas
5
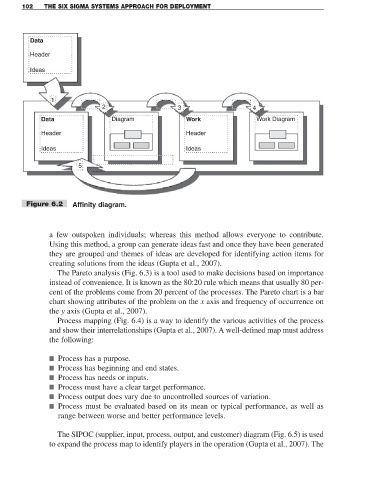
Figure 6.2 Affinity diagram.
a few outspoken individuals; whereas this method allows everyone to contribute.
Using this method, a group can generate ideas fast and once they have been generated
they are grouped and themes of ideas are developed for identifying action items for
creating solutions from the ideas (Gupta et al., 2007).
The Pareto analysis (Fig. 6.3) is a tool used to make decisions based on importance
instead of convenience. It is known as the 80:20 rule which means that usually 80 per-
cent of the problems come from 20 percent of the processes. The Pareto chart is a bar
chart showing attributes of the problem on the x axis and frequency of occurrence on
the y axis (Gupta et al., 2007).
Process mapping (Fig. 6.4) is a way to identify the various activities of the process
and show their interrelationships (Gupta et al., 2007). A well-defined map must address
the following:
■ Process has a purpose.
■ Process has beginning and end states.
■ Process has needs or inputs.
■ Process must have a clear target performance.
■ Process output does vary due to uncontrolled sources of variation.
■ Process must be evaluated based on its mean or typical performance, as well as
range between worse and better performance levels.
The SIPOC (supplier, input, process, output, and customer) diagram (Fig. 6.5) is used
to expand the process map to identify players in the operation (Gupta et al., 2007). The