
Page 379 - Solid Waste Analysis and Minimization a Systems Approach
P. 379
ECONOMICS 357
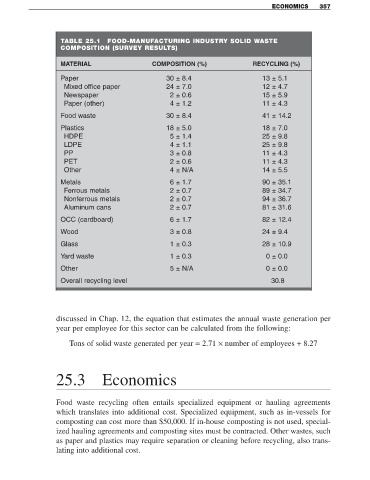
TABLE 25.1 FOOD-MANUFACTURING INDUSTRY SOLID WASTE
COMPOSITION (SURVEY RESULTS)
MATERIAL COMPOSITION (%) RECYCLING (%)
Paper 30 ± 8.4 13 ± 5.1
Mixed office paper 24 ± 7.0 12 ± 4.7
Newspaper 2 ± 0.6 15 ± 5.9
Paper (other) 4 ± 1.2 11 ± 4.3
Food waste 30 ± 8.4 41 ± 14.2
Plastics 18 ± 5.0 18 ± 7.0
HDPE 5 ± 1.4 25 ± 9.8
LDPE 4 ± 1.1 25 ± 9.8
PP 3 ± 0.8 11 ± 4.3
PET 2 ± 0.6 11 ± 4.3
Other 4 ± N/A 14 ± 5.5
Metals 6 ± 1.7 90 ± 35.1
Ferrous metals 2 ± 0.7 89 ± 34.7
Nonferrous metals 2 ± 0.7 94 ± 36.7
Aluminum cans 2 ± 0.7 81 ± 31.6
OCC (cardboard) 6 ± 1.7 82 ± 12.4
Wood 3 ± 0.8 24 ± 9.4
Glass 1 ± 0.3 28 ± 10.9
Yard waste 1 ± 0.3 0 ± 0.0
Other 5 ± N/A 0 ± 0.0
Overall recycling level 30.8
discussed in Chap. 12, the equation that estimates the annual waste generation per
year per employee for this sector can be calculated from the following:
Tons of solid waste generated per year = 2.71 × number of employees + 8.27
25.3 Economics
Food waste recycling often entails specialized equipment or hauling agreements
which translates into additional cost. Specialized equipment, such as in-vessels for
composting can cost more than $50,000. If in-house composting is not used, special-
ized hauling agreements and composting sites must be contracted. Other wastes, such
as paper and plastics may require separation or cleaning before recycling, also trans-
lating into additional cost.