Page 447 - Solid Waste Analysis and Minimization a Systems Approach
P. 447

WASTE MANAGEMENT GOALS AND OPPORTUNITIES              425


                      Technicians are generally more experienced workers who troubleshoot production
                    problems and make equipment adjustments and repairs. They take the lead in assuring
                    quality control and in maintaining equipment. They also test completed chips to make
                    sure they work properly. To keep equipment repairs to a minimum, technicians perform
                    diagnostic analyses and run computations. For example, technicians may determine if
                    a flaw in a chip is due to contamination and peculiar to that wafer, or if the flaw is
                    inherent in the manufacturing process.


                    33.2 Waste Management Goals

                    and Opportunities


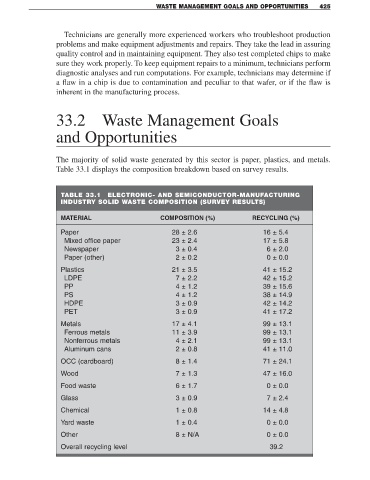
                    The majority of solid waste generated by this sector is paper, plastics, and metals.
                    Table 33.1 displays the composition breakdown based on survey results.


                     TABLE 33.1      ELECTRONIC- AND SEMICONDUCTOR-MANUFACTURING
                     INDUSTRY SOLID WASTE COMPOSITION (SURVEY RESULTS)

                     MATERIAL                         COMPOSITION (%)               RECYCLING (%)

                     Paper                                28 ± 2.6                      16 ± 5.4
                      Mixed office paper                   23 ± 2.4                      17 ± 5.8
                      Newspaper                            3 ± 0.4                       6 ± 2.0
                      Paper (other)                        2 ± 0.2                       0 ± 0.0

                     Plastics                             21 ± 3.5                      41 ± 15.2
                      LDPE                                 7 ± 2.2                      42 ± 15.2
                      PP                                   4 ± 1.2                      39 ± 15.6
                      PS                                   4 ± 1.2                      38 ± 14.9
                      HDPE                                 3 ± 0.9                      42 ± 14.2
                      PET                                  3 ± 0.9                      41 ± 17.2
                     Metals                               17 ± 4.1                      99 ± 13.1
                      Ferrous metals                      11 ± 3.9                      99 ± 13.1
                      Nonferrous metals                    4 ± 2.1                      99 ± 13.1
                      Aluminum cans                        2 ± 0.8                      41 ± 11.0
                     OCC (cardboard)                       8 ± 1.4                      71 ± 24.1
                     Wood                                  7 ± 1.3                      47 ± 16.0

                     Food waste                            6 ± 1.7                       0 ± 0.0

                     Glass                                 3 ± 0.9                       7 ± 2.4
                     Chemical                              1 ± 0.8                      14 ± 4.8

                     Yard waste                            1 ± 0.4                       0 ± 0.0
                     Other                                 8 ± N/A                       0 ± 0.0

                     Overall recycling level                                              39.2
   442   443   444   445   446   447   448   449   450   451   452