
Page 480 - Solid Waste Analysis and Minimization a Systems Approach
P. 480
458 HEALTH SYSTEM APPLICATIONS
36.2 Waste Management Goals
and Opportunities
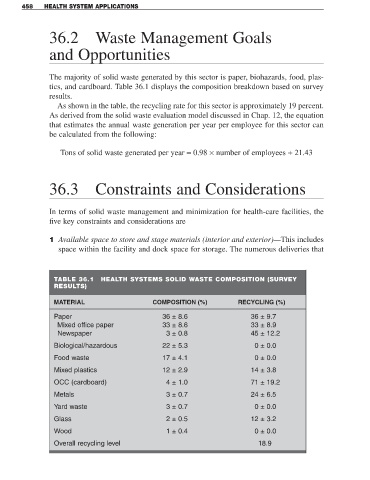
The majority of solid waste generated by this sector is paper, biohazards, food, plas-
tics, and cardboard. Table 36.1 displays the composition breakdown based on survey
results.
As shown in the table, the recycling rate for this sector is approximately 19 percent.
As derived from the solid waste evaluation model discussed in Chap. 12, the equation
that estimates the annual waste generation per year per employee for this sector can
be calculated from the following:
Tons of solid waste generated per year = 0.98 × number of employees + 21.43
36.3 Constraints and Considerations
In terms of solid waste management and minimization for health-care facilities, the
five key constraints and considerations are
1 Available space to store and stage materials (interior and exterior)—This includes
space within the facility and dock space for storage. The numerous deliveries that
TABLE 36.1 HEALTH SYSTEMS SOLID WASTE COMPOSITION (SURVEY
RESULTS)
MATERIAL COMPOSITION (%) RECYCLING (%)
Paper 36 ± 8.6 36 ± 9.7
Mixed office paper 33 ± 8.6 33 ± 8.9
Newspaper 3 ± 0.8 45 ± 12.2
Biological/hazardous 22 ± 5.3 0 ± 0.0
Food waste 17 ± 4.1 0 ± 0.0
Mixed plastics 12 ± 2.9 14 ± 3.8
OCC (cardboard) 4 ± 1.0 71 ± 19.2
Metals 3 ± 0.7 24 ± 6.5
Yard waste 3 ± 0.7 0 ± 0.0
Glass 2 ± 0.5 12 ± 3.2
Wood 1 ± 0.4 0 ± 0.0
Overall recycling level 18.9