
Page 505 - Solid Waste Analysis and Minimization a Systems Approach
P. 505
CONSTRAINTS AND CONSIDERATIONS 483
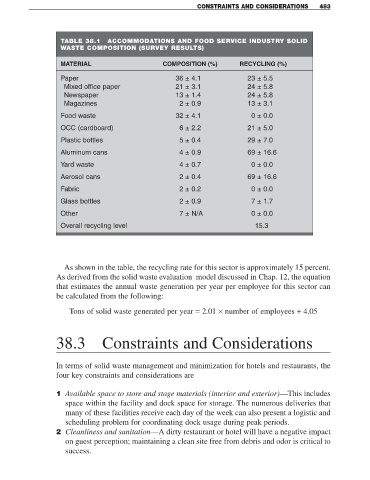
TABLE 38.1 ACCOMMODATIONS AND FOOD SERVICE INDUSTRY SOLID
WASTE COMPOSITION (SURVEY RESULTS)
MATERIAL COMPOSITION (%) RECYCLING (%)
Paper 36 ± 4.1 23 ± 5.5
Mixed office paper 21 ± 3.1 24 ± 5.8
Newspaper 13 ± 1.4 24 ± 5.8
Magazines 2 ± 0.9 13 ± 3.1
Food waste 32 ± 4.1 0 ± 0.0
OCC (cardboard) 6 ± 2.2 21 ± 5.0
Plastic bottles 5 ± 0.4 29 ± 7.0
Aluminum cans 4 ± 0.9 69 ± 16.6
Yard waste 4 ± 0.7 0 ± 0.0
Aerosol cans 2 ± 0.4 69 ± 16.6
Fabric 2 ± 0.2 0 ± 0.0
Glass bottles 2 ± 0.9 7 ± 1.7
Other 7 ± N/A 0 ± 0.0
Overall recycling level 15.3
As shown in the table, the recycling rate for this sector is approximately 15 percent.
As derived from the solid waste evaluation model discussed in Chap. 12, the equation
that estimates the annual waste generation per year per employee for this sector can
be calculated from the following:
Tons of solid waste generated per year = 2.01 × number of employees + 4.05
38.3 Constraints and Considerations
In terms of solid waste management and minimization for hotels and restaurants, the
four key constraints and considerations are
1 Available space to store and stage materials (interior and exterior)—This includes
space within the facility and dock space for storage. The numerous deliveries that
many of these facilities receive each day of the week can also present a logistic and
scheduling problem for coordinating dock usage during peak periods.
2 Cleanliness and sanitation—A dirty restaurant or hotel will have a negative impact
on guest perception; maintaining a clean site free from debris and odor is critical to
success.