
Page 118 - Standard Handbook Of Petroleum & Natural Gas Engineering
P. 118
Applied Statistics 103
Excedence Probability (%)
99.99 99.9 99.8 99 98 95 90 80 70 60 50 40 30 20 10 5 2 1 .5 .2 .1 .05
200001 II I I I I l l 1 I I I I IIl/lII
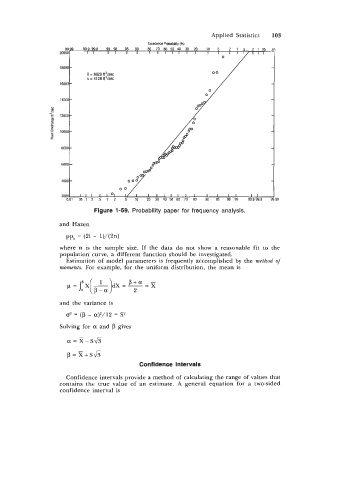
K = 8620 ft3/sec
s = 4128 ft3/sec
.
P
“r: 12000
u
10000
I
6000
4000
2000 A-L Ill01 I/I IIIIIII I I I I II
0.01 05 .1 .2 .5 1 2 5 10 20 30 40 50 60 70 80 90 95 98 99 99.899.9 99
Figure 1-59. Probability paper for frequency analysis.
and Hazen
where n is the sample size. If the data do not show a reasonable fit to the
population curve, a different function should be investigated.
Estimation of model parameters is frequently accomplished by the method of
moments. For example, for the uniform distribution, the mean is
and the variance is
o2 = (p - a)’/12 = Sz
Solving for a and p gives
a = X-SA
p=X+S&
Confidence Intervals
Confidence intervals provide a method of calculating the range of values that
contains the true value of an estimate. A general equation for a two-sided
confidence interval is