
Page 87 - Standard Handbook Of Petroleum & Natural Gas Engineering
P. 87
76 Mathematics
Relaxation methods may also be used to modify the value of an unknown before
it is used in the next calculation. The effect of the relaxation factor h may be seen
in the following equation, where ~("+l)' is the value obtained at the present iteration.
and 0 < h < 2. If 0 < h < 1, the effect is termed underrelaxation, which is
frequently employed to produce convergence in a nonconvergent process. If
1 < h < 2, the effect, overrelaxation, will be to accelerate an already convergent
process.
Least Squares Curve Fitting
For a function f(x) given only as discrete points, the measure of accuracy of
the fit is a function d(x) = I f(x) - g(x) 1 where g(x) is the approximating
function to f(x). If this is interpreted as minimizing d(x) over all x in the interval,
one point in error can cause a major shift in the approximating function towards
that point. The better method is the least squares curve fit, where d(x) is
minimized if
is minimized, and for a polynomial of order m
E = x[ao+a,x, +a&+ . . . + a,xy - f(x, )I'
,=I
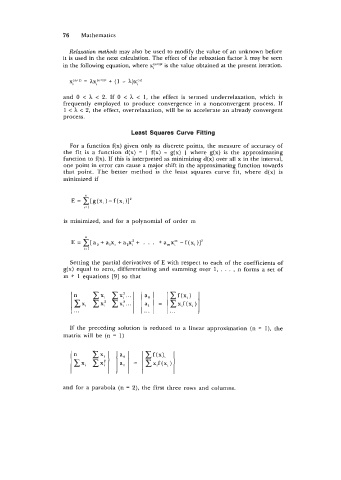
Setting the partial derivatives of E with respect to each of the coefficients of
g(x) equal to zero, differentiating and summing over 1, . . . , n forms a set of
m + 1 equations [9] so that
If the preceding solution is reduced to a linear approximation (n = l), the
matrix will be (n = 1)
and for a parabola (n = 2), the first three rows and columns.