
Page 174 - Standard Handbook Petroleum Natural Gas Engineering VOLUME2
P. 174
Formation Evaluation 143
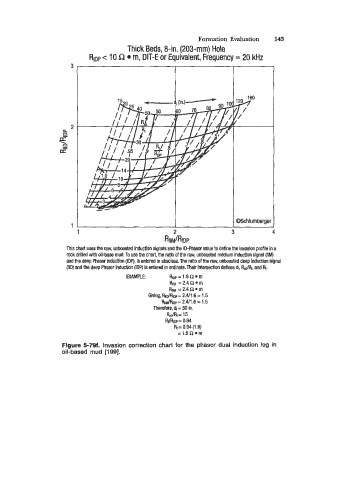
Thick Beds, 8-in. (203-mm) Hole
Rl~p < 10 Q m, DIT-E or Equivalent, Frequency = 20 kHz
3
2
n
n
a-
z
\
a-
I I QSchlumberger
1 2 3 4
RIIM~IP
This chart uses the raw, unboosted induction signals and the ID-Phasor value to define the invasion profile in a
rock drilled with oil-base mud. To use the chart, the ratio of the raw, unboosted medium induction signal (IIM)
and the deep Phasor induction (IDP), is entered in abscissa.The ratio of the raw, unboosted deep induction signal
QlD) and the deep Phasor induction (IDP) is entered in ordinate. Their intersection defines dl, R&, and Rt.
=
WPLE h~p 1.6 R m
Rim = 2.4 $2 m
RIM =2.4n*m
Giving, RndRlop = 2.4/1.6 = 1.5
RHM/RIOP = 2.411.6 = 1.5
Therefore, dl = 50 in.
RdRt = 15
Rdftmp = 0.94
Rt=O.94(1.6)
= 1.5 R m
Figure 5-79f. Invasion correction chart for the phasor dual induction log in
oil-based mud [199].