
Page 177 - Standard Handbook Petroleum Natural Gas Engineering VOLUME2
P. 177
146 Reservoir Engineering
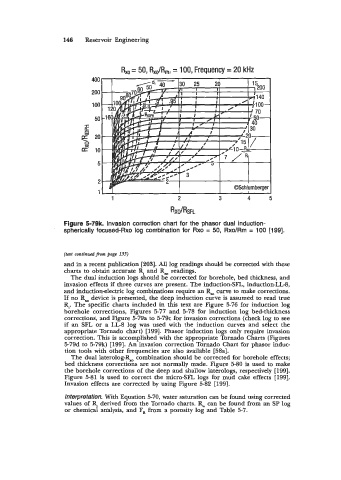
Rxo = 50, RxJRm, = 100, Frequency = 20 kHz
400
200
100
50
I
n
CF 20
3
cr= 10
5
2
1
1 2 3 4 5
RXO/RSFL
Figure 5-79k. Invasion correction chart for the phasor dual induction-
spherically focused-Rxo log combination for Rxo = 50, Rxo/Rm = 100 [199].
(text continued from page 135)
and in a recent publication [203]. All log readings should be corrected with these
charts to obtain accurate R, and R, readings.
The dual induction logs should be corrected for borehole, bed thickness, and
invasion effects if three curves are present. The induction-SFL, induction-118,
and induction-electric log combinations require an R, curve to make corrections.
If no R, device is presented, the deep induction curve is assumed to read true
R,. The specific charts included in this text are Figure 5-76 for induction log
borehole corrections, Figures 5-77 and 5-78 for induction log bed-thickness
corrections., and Figure 5-79a to 5-79c for invasion corrections (check log to see
if an SFL or a LL-8 log was used with the induction curves and select the
appropriate Tornado chart) [ 1991. Phasor induction logs only require invasion
correction. This is accomplished with the appropriate Tornado Charts (Figures
5-79d to 5-79k) [199]. An invasion correction Tornado Chart for phasor induc-
tion tools with other frequencies are also available [58a].
The dual laterolog-Rxo combination should be corrected for borehole effects;
bed thickness corrections are not normally made. Figure 5-80 is used to make
the borehole corrections of the deep and shallow laterologs, respectively [199].
Figure 5-81 is used to correct the micro-SFL logs for mud cake effects [199].
Invasion effects are corrected by using Figure 5-82 [199].
Interpretation. With Equation 5-70, water saturation can be found using corrected
values of R, derived from the Tornado charts. R, can be found from an SP log
or chemical analysis, and F, from a porosity log and Table 5-7.