Page 218 - Standard Handbook Petroleum Natural Gas Engineering VOLUME2
P. 218

Formation Evaluation   187


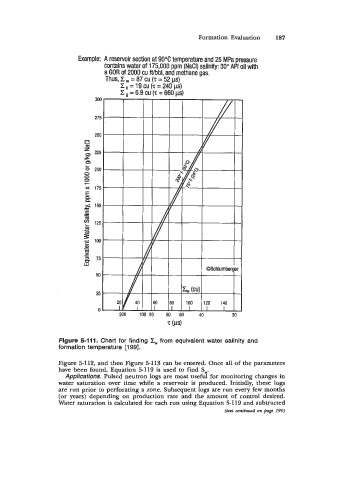
                        Example: A reservoir section at 90°C temperature and 25 MPa pressure
                                contains water of 175,000 ppm (NaCI) salinity: 30" API oil with
                                a GOR of 2000 cu fthbl, and methane gas.
                                Thus, Z  = 87 cu (7 = 52 pi)
                                     Z,=19cU(Z=24Op)
                                     C, = 6.9 cu (Z = 660 pi)
                             300

                             275


                             250
                          B
                          ;
                          \  225
                          UJ
                          b  200
                          0
                          0
                          0
                          F
                          %  175
                          !E
                          P
                          2; 150
                          .-
                          .-  -
                          S
                          m
                          '2  125
                          B
                          3
                          Q)  -  100
                          .- B
                          s
                          3  75
                              50

                              25

                              0


                   Figure 5-111.  Chart for  finding Zw from  equivalent water  salinity  and
                   formation  temperature [199].

                   Figure 5-112, and then Figure 5-113 can be entered. Once all of  the parameters
                   have been found, Equation 5-119 is used to find Sw.
                     Applications. Pulsed neutron logs are most useful for monitoring changes in
                   water  saturation  over  time  while  a reservoir is  produced.  Initially, these logs
                   are run prior to perforating a zone. Subsequent logs are run every few months
                   (or years) depending  on  production  rate  and  the  amount of  control desired.
                   Water saturation is calculated for each run using Equation 5-119 and subtracted
                                                                    (text  continued on page  190)
   213   214   215   216   217   218   219   220   221   222   223