
Page 222 - Standard Handbook Petroleum Natural Gas Engineering VOLUME2
P. 222
Formation Evaluation 191
0 5 10 15 20 25 30 35 40 45
9, Porosiu (pu)
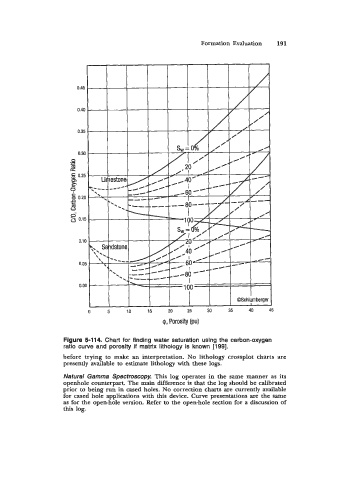
Figure 5-114. Chart for finding water saturation using the carbon-oxygen
ratio curve and porosity if matrix lithology is known 11991.
before trying to make an interpretation. No lithology crossplot charts are
presently available to estimate lithology with these logs.
Natural Gamma Spectroscopy. This log operates in the same manner as its
openhole counterpart. The main difference is that the log should be calibrated
prior to being run in cased holes. No correction charts are currently available
for cased hole applications with this device. Curve presentations are the same
as for the open-hole version. Refer to the open-hole section for a discussion of
this log.