
Page 227 - Standard Handbook Petroleum Natural Gas Engineering VOLUME2
P. 227
196 Reservoir Engineering
and type of cement used. Ideally, an index of 1.0 indicates excellent pipecement
bonding; decreasing values show deteriorating conditions which may require
squeezing to bring bonding up to acceptable standards. A bond index curve may
be presented in track 2.
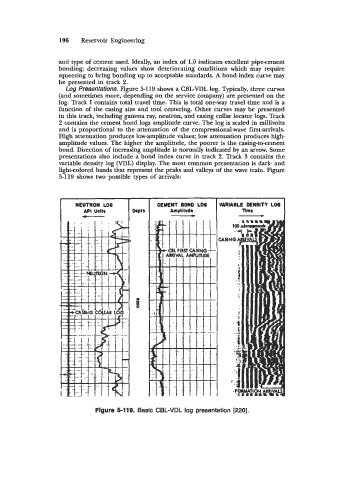
Log Presentations. Figure 5-1 19 shows a CBLVDL log. Typically, three curves
(and sometimes more, depending on the service company) are presented on the
log. Track I contains total travel time. This is total one-way travel time and is a
function of the casing size and tool centering. Other curves may be presented
in this track, including gamma ray, neutron, and casing collar locator logs. Track
2 contains the cement bond logs amplitude curve. The log is scaled in millivolts
and is proportional to the attenuation of the compressional-wave first-arrivals.
High attenuation produces low-amplitude values; low attenuation produces high-
amplitude values. The higher the amplitude, the poorer is the casing-to-cement
bond. Direction of increasing amplitude is normally indicated by an arrow. Some
presentations also include a bond index curve in track 2. Track 3 contains the
variable density log (VDL) display. The most common presentation is dark- and
light-colored bands that represent the peaks and valleys of the wave train. Figure
5-1 19 shows two possible types of arrivals:
-
T-+h I CEMENT BOND LOB
FEUFZi,F Amplituda
C-L I I I I
1 8 , . . I : . !(I
Figure 5-119. Basic CBL-VDL log presentation [220].