
Page 242 - Standard Handbook Petroleum Natural Gas Engineering VOLUME2
P. 242
Formation Evaluation 2 11
600
; :
i..
>
;
,........ :.>% .... ; ._....._.. J = -S LO P E ...... ........ i ....._.. ......
i \\i
I ’ . =-(527)/(2000-3000)
i‘.
200
9
0
2000 2500 3000
WELL PRESSURE, PWf psia
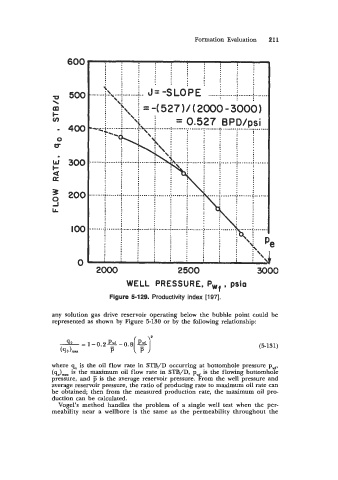
Figure 5-129. Productivity index [197].
any solution gas drive reservoir operating below the bubble point could be
represented as shown by Figure 5-130 or by the following relationship:
(5-131)
where Q is the oil flow rate in STB/D occurring at bottomhole pressure pWr,
(qo)mm is the maximum oil flow rate in STB/D, pWf is the flowing bottomhole
pressure, and is the average reservoir pressure. From the well pressure and
average reservoir pressure, the ratio of producing rate to maximum oil rate can
be obtained; then from the measured production rate, the maximum oil pro-
duction can be calculated.
Vogel’s method handles the problem of a single well test when the per-
meability near a wellbore is the same as the permeability throughout the