
Page 244 - Standard Handbook Petroleum Natural Gas Engineering VOLUME2
P. 244
Formation Evaluation 4 13
0 0.2 0.4 0.6 0.8 1.0
RATIO: OIL PRODUCING RATE TO MAX. RATE WITHOUT DAMAGE, qo/(qo,~~~. FRAC.
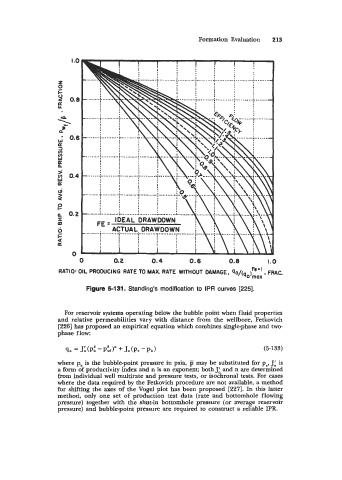
Figure 5-131. Standing’s modification to IPR curves [225].
For reservoir systems operating below the bubble point when f hid properties
and relative permeabilities vary with distance from the wellbore, Fetkovich
[226] has proposed an empirical equation which combines single-phase and two-
phase flow:
90 = J:(P~ -P;Y + JO(P.-P~) (5-133)
where pb is the bubble-point pressure in psia, j5 may be substituted for p,, JA is
a form of productivity index and n is an exponent; both JA and n are determined
from individual well multirate and pressure tests, or isochronal tests. For cases
where the data required by the Fetkovich procedure are not available, a method
for shifting the axes of the Vogel plot has been proposed [227]. In this latter
method, only one set of production test data (rate and bottomhole flowing
pressure) together with the shut-in bottomhole pressure (or average reservoir
pressure) and bubble-point pressure are required to construct a reliable IPR.