
Page 263 - Standard Handbook Petroleum Natural Gas Engineering VOLUME2
P. 263
232 Reservoir Engineering
Graphical Form of Material Balance (p/z Plots)
For volumetric gas reservoirs in which there is no water influx and negligible
water production, the definition of gas formation volume factor (Equation 5-3)
can be substituted into Equation 5-145, and the resulting equation can be
rearranged to give [197]:
(5-147)
where all terms are as defined previously and the subscript i refers to initial
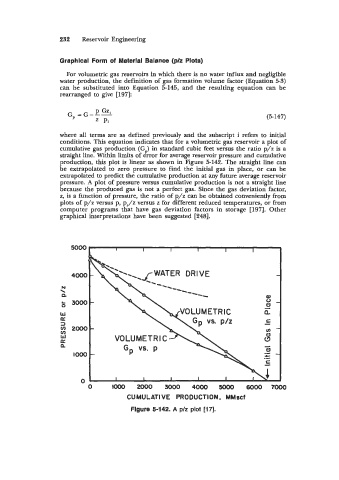
conditions. This equation indicates that for a volumetric gas reservoir a plot of
cumulative gas production (Gp) in standard cubic feet versus the ratio p/z is a
straight line. Within limits of error for average reservoir pressure and cumulative
production, this plot is linear as shown in Figure 5-142. The straight line can
be extrapolated to zero pressure to find the initial gas in place, or can be
extrapolated to predict the cumulative production at any future average reservoir
pressure. A plot of pressure versus cumulative production is not a straight line
because the produced gas is not a perfect gas. Since the gas deviation factor,
z, is a function of pressure, the ratio of p/z can be obtained conveniently from
plots of p/z versus p, p,/z versus z for different reduced temperatures, or from
computer programs that have gas deviation factors in storage [197]. Other
graphical interpretations have been suggested [248].
5000
4000 WATER DRIVE
N
\
n
& 3000
w
a
2000
w
a
n
IO00
0
0 IO00 2000 3000 4000 so00 6000 7000
CUMULATIVE PRODUCTION, MMscf
Flgure 5-142. A p/z plot [17].