
Page 422 - Standard Handbook Petroleum Natural Gas Engineering VOLUME2
P. 422
388 Production
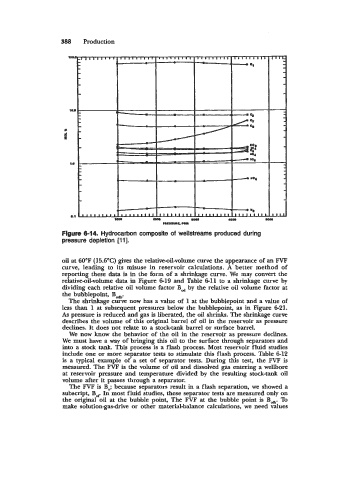
Flgure 6-14. Hydrocarbon composite of wellstreams produced during
pressure depletion Ill].
oil at 60°F (15.6OC) gives the relative-oil-volume curve the appearance of an FVF
curve, leading to its misuse in reservoir calculations. A better method of
reporting these data is in the form of a shrinkage curve. We may convert the
relative-oil-volume data in Figure 619 and Table 611 to a shrinkage curve by
dividing each relative oil volume factor B, by the relative oil volume factor at
the bubblepoint, Bd.
The shrinkage curve now has a value of 1 at the bubblepoint and a value of
less than 1 at subsequent pressures below the bubblepoint, as in Figure 621.
As pressure is reduced and gas is liberated? the oil shrinks. The shrinkage curve
describes the volume of this original barrel of oil in the reservoir as pressure
declines. It does not relate to a stock-tank barrel or surface barrel.
We now know the behavior of the oil in the reservoir as pressure declines.
We must have a way of bringing this oil to the surface through separators and
into a stock tank. This process is a flash process. Most reservoir fluid studies
include one or more separator tests to stimulate this flash process. Table 6-12
is a typical example of a set of separator tests. During this test, the FVF is
measured. The FVF is the volume of oil and dissolved gas entering a wellbore
at reservoir pressure and temperature divided by the resulting stock-tank oil
volume after it passes through a separator.
The FVF is Bo; because separators result in a flash separation, we showed a
subscript? B, In most fluid studies, these separator tests are measured only on
the original oil at the bubble point, The FVF at the bubble point is B,. To
make solution~asdrive or other material-balance calculations, we need values