
Page 424 - Standard Handbook Petroleum Natural Gas Engineering VOLUME2
P. 424
390 Production
100
80
w
2
2 40
3
f
0
20
0
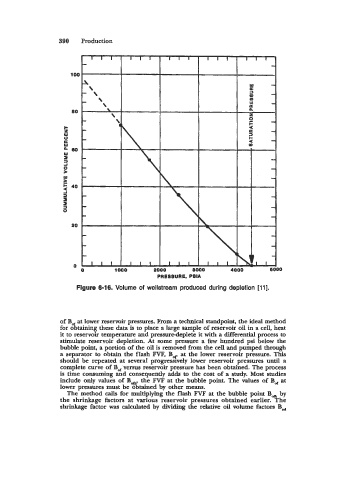
Figure 6-1 6. Volume of wellstream produced during depletion [ll].
of B, at lower reservoir pressures. From a technical standpoint, the ideal method
for obtaining these data is to place a large sample of reservoir oil in a cell, heat
it to reservoir temperature and pressure-deplete it with a differential process to
stimulate reservoir depletion. At some pressure a few hundred psi below the
bubble point, a portion of the oil is removed from the cell and pumped through
a separator to obtain the flash FVF, B, at the lower reservoir pressure. This
should be repeated at several progressively lower reservoir pressures until a
complete curve of B, versus reservoir pressure has been obtained. The process
is time consuming and consequently adds to the cost of a study. Most studies
include only values of Bo, the FVF at the bubble point. The values of Bd at
lower pressures must be obtained by other means.
The method calls for multiplying the flash FVF at the bubble point B,, by
the shrinkage factors at various reservoir pressures obtained earlier. The
shrinkage factor was calculated by dividing the relative oil volume factors Bod