Page 473 - Standard Handbook Petroleum Natural Gas Engineering VOLUME2
P. 473
Flow  of  Fluids   429


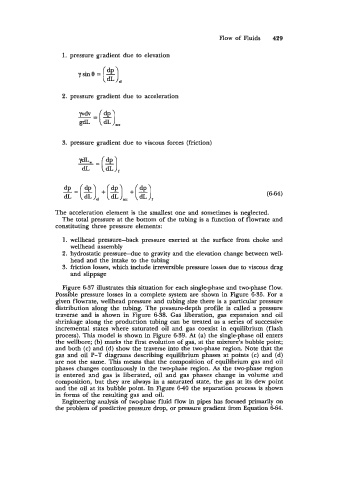
                   1. pressure gradient due to elevation
                        ysine = (2)


                                    d
                   2.  pressure gradient due to acceleration


                   3.  pressure gradient due to viscous forces (friction)


                    2 =(g)=, +(g)= +(g)                                         (6-64)

                                              f

                 The acceleration element is the smallest one and sometimes is neglected.
                   The total pressure at the bottom of  the tubing is a function of flowrate and
                 constituting three pressure elements:

                    1. wellhead pressure-back  pressure  exerted at  the  surface from  choke and
                      wellhead assembly
                    2.  hydrostatic pressure-due  to gravity and the elevation change between well-
                      head and the intake to the tubing
                    3.  friction losses, which include irreversible pressure losses due to viscous drag
                      and slippage
                    Figure 6-37 illustrates this situation for each single-phase and two-phase flow.
                  Possible pressure losses in a complete system are shown in Figure 6-35. For  a
                  given f lowrate, wellhead pressure and tubing size there is a particular pressure
                  distribution along the  tubing. The pressure-depth profile is  called  a pressure
                  traverse  and  is  shown  in  Figure  6-38.  Gas  liberation,  gas expansion and  oil
                  shrinkage along the production tubing can be treated as a series of  successive
                  incremental  states where  saturated  oil  and  gas  coexist in  equilibrium (flash
                  process). This model is shown in Figure 6-39. At  (a) the single-phase oil enters
                  the wellbore; (b) marks the first evolution of gas, at the mixture’s bubble point;
                  and both (c) and (d) show the traverse into the two-phase region. Note that the
                  gas and oil P-T  diagrams describing equilibrium phases at points (c) and (d)
                  are not the same. This means that the composition of  equilibrium gas and oil
                 phases changes continuously in the two-phase region. As  the two-phase region
                 is  entered  and  gas  is  liberated,  oil  and  gas  phases  change  in  volume  and
                  composition, but  they are always  in  a saturated state, the gas at its dew point
                  and the oil at its bubble point. In Figure 640 the separation process is shown
                 in forms of  the resulting gas and oil.
                   Engineering analysis of  two-phase fluid flaw in pipes has focused primarily on
                  the problem of predictive pressure drop, or pressure gradient from Equation 6-64.

