
Page 476 - Standard Handbook Petroleum Natural Gas Engineering VOLUME2
P. 476
432 Production
SEPARATOR GAS
P I
PSP
SEPARATION OIL
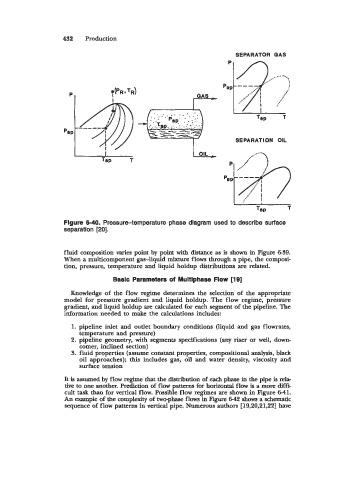
Figure 6-40. Pressure-temperature phase diagram used to describe surface
separation [20].
fluid composition varies point by point with distance as is shown in Figure 699.
When a multicomponent gas-liquid mixture flows through a pipe, the composi-
tion, pressure, temperature and liquid holdup distributions are related.
Basic Parameters of Multlphase Flow [19]
Knowledge of the flow regime determines the selection of the appropriate
model for pressure gradient and liquid holdup. The flow regime, pressure
gradient, and liquid holdup are calculated for each segment of the pipeline. The
information needed to make the calculations includes:
1. pipeline inlet and outlet boundary conditions (liquid and gas flowrates,
temperature and pressure)
2. pipeline geometry, with segments specifications (any ris.er or well, down-
comer, inclined section)
3. f hid properties (assume constant properties, compositional analysis, black
oil approaches); this includes gas, oil and water density, viscosity and
surface tension
It is assumed by flaw regime that the distribution of each phase in the pipe is rela-
tive to one another. Prediction of flaw patterns for horizontal flow is a more diffi-
cult task than for vertical flow. Possible flow regimes are shown in Figure 6-41.
An example of the complexity of two-phase flows in Figure 6-42 shows a schematic
sequence of flow patterns in vertical pipe. Numerous authors [19,20,21,22] have