Page 89 - Standard Handbook Petroleum Natural Gas Engineering VOLUME2
P. 89

Basic  Principles, Definitions, and  Data   77


                  [154] showed that  each of  the relative permeabilities  could be  calculated even
                  when gravity is not neglected. Other calculations of  relative permeabilities have
                  been proposed by  Higgins [155], Guerrero and Stewart [156,157], and a graphical
                  technique  has been  presented  by Jones  and Rozelle [158].
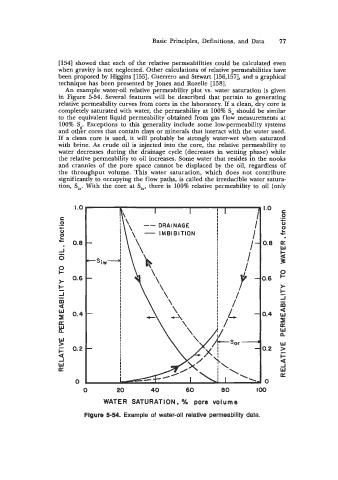
                    An  example water-oil relative permeability plot vs.  water  saturation is given
                  in  Figure  5-54. Several features  will  be  described  that  pertain  to  generating
                  relative permeability curves from cores in the laboratory. If a clean, dry core is
                  completely saturated with water, the permeability at  100% Sw should be similar
                  to  the equivalent liquid permeability  obtained from gas flow measurements at
                  100% Sg.  Exceptions to  this  generality  include  some low-permeability systems
                  and other cores that contain clays or minerals that interact with the water used.
                  If  a  clean  core  is  used,  it  will  probably be  strongly water-wet when  saturated
                  with  brine.  As  crude oil is  injected into  the  core,  the  relative permeability  to
                  water  decreases  during  the  drainage  cycle  (decreases in wetting phase) while
                  the relative permeability to oil increases. Some water that resides in the nooks
                  and  crannies  of  the  pore  space cannot  be  displaced by  the  oil,  regardless  of
                  the  throughput  volume.  This  water  saturation, which  does  not  contribute
                  significantly to occupying the flow paths, is called the irreducible water satura-
                  tion,  Siw. With  the  core  at Siw, there  is  100% relative permeability  to  oil (only

                       I .o                                                  f  1.0
                                     \         I         I         I         I
                   c
                  .-                                                        I
                   0
                  c
                   0                                                        I
                   2
                  rc                                                       I-  0.8
                   . 0.8
                  -
                  -I
                  0                                                       I
                  e                                                      I
                  >   0.6                                              4
                  k
                  -
                  -1
                  m                                                  /
                  a                                                         -
                      0.4                                           L         0.4
                  a                                                1
                  k!                                              I
                  w
                  -                                               -Sor      -
                  >
                                                                              0.2
                  c  0.2
                  a
                  J
                  W                                               \
                  a                                                  \
                       0                                           I    ‘lo
                          0        20         40        60        80         loo
                               WATER  SATURATION.  %  pore  volume

                          Figure 5-54.  Example of  water-oil  relative permeability data.
   84   85   86   87   88   89   90   91   92   93   94