
Page 105 - Statistics II for Dummies
P. 105
Chapter 5: Multiple Regression with Two X Variables 89
You can see from Figure 5-1a that TV spending does appear to have a fairly
strong linear relationship with sales. This observation provides evidence
that TV ad spending may be useful in estimating plasma TV sales. Figure
5-1b shows a linear relationship between newspaper ad spending and sales,
but the relationship isn’t as strong as the one between TV ads and sales.
However, it still may be somewhat helpful in estimating sales.
Correlations: Examining the bond
The second portion of step three involves calculating and examining the
correlations between the x variables and the y variable. (Of course, if a
scatterplot of an x variable and the y variable fails to come up with a pattern,
then you drop that x variable altogether and don’t proceed to find the
correlation.)
Whenever you employ scatterplots to explore possible linear relationships,
correlations are typically not far behind. The correlation coefficient is a
number that measures the strength and direction of the linear relationship
between two variables, x and y. (See Chapter 4 for the lowdown on correlation.)
This step involves two parts:
✓ Finding and interpreting the correlations
✓ Testing the correlations to see which ones are statistically significant
(thereby determining which x variables are significantly related to y)
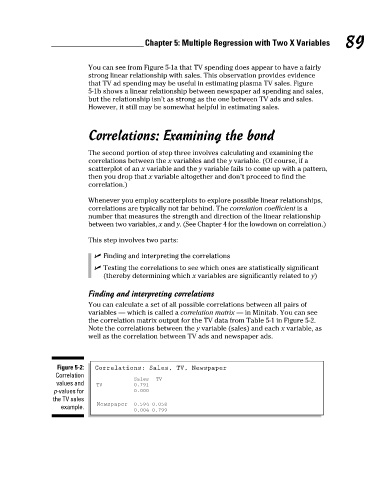
Finding and interpreting correlations
You can calculate a set of all possible correlations between all pairs of
variables — which is called a correlation matrix — in Minitab. You can see
the correlation matrix output for the TV data from Table 5-1 in Figure 5-2.
Note the correlations between the y variable (sales) and each x variable, as
well as the correlation between TV ads and newspaper ads.
Figure 5-2: Correlations: Sales, TV, Newspaper
Correlation
Sales TV
values and TV 0.791
p-values for 0.000
the TV sales
example. Newspaper 0.594 0.058
0.004 0.799
10_466469-ch05.indd 89 7/24/09 9:32:33 AM