
Page 116 - Statistics II for Dummies
P. 116
100 Part II: Using Different Types of Regression to Make Predictions
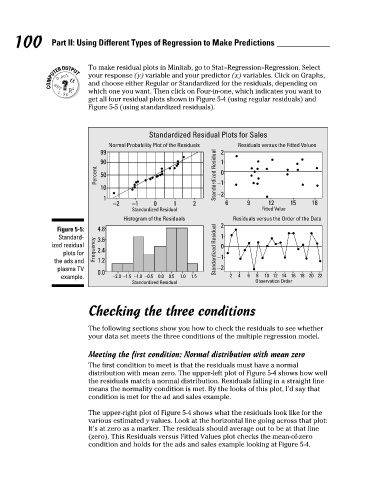
To make residual plots in Minitab, go to Stat>Regression>Regression. Select
your response (y) variable and your predictor (x) variables. Click on Graphs,
and choose either Regular or Standardized for the residuals, depending on
which one you want. Then click on Four-in-one, which indicates you want to
get all four residual plots shown in Figure 5-4 (using regular residuals) and
Figure 5-5 (using standardized residuals).
Standardized Residual Plots for Sales
Normal Probability Plot of the Residuals Residuals versus the Fitted Values
99 2
90 1
Percent 50 Standardized Residual 0
10 −1
1 −2
−2 −1 0 1 2 6 9 12 15 18
Standardized Residual Fitted Value
Histogram of the Residuals Residuals versus the Order of the Data
Figure 5-5: 4.8 2
Standard- 3.6 1
ized residual 0
plots for Frequency 2.4 Standardized Residual
the ads and 1.2 −1
plasma TV −2
0.0
8
10 12 14 16 18 20 22
example. −2.0 −1.5 −1.0 −0.5 0.0 0.5 1.0 1.5 2 4 6 Observation Order
Standardized Residual
Checking the three conditions
The following sections show you how to check the residuals to see whether
your data set meets the three conditions of the multiple regression model.
Meeting the first condition: Normal distribution with mean zero
The first condition to meet is that the residuals must have a normal
distribution with mean zero. The upper-left plot of Figure 5-4 shows how well
the residuals match a normal distribution. Residuals falling in a straight line
means the normality condition is met. By the looks of this plot, I’d say that
condition is met for the ad and sales example.
The upper-right plot of Figure 5-4 shows what the residuals look like for the
various estimated y values. Look at the horizontal line going across that plot:
It’s at zero as a marker. The residuals should average out to be at that line
(zero). This Residuals versus Fitted Values plot checks the mean-of-zero
condition and holds for the ads and sales example looking at Figure 5-4.
10_466469-ch05.indd 100 7/24/09 9:32:35 AM