
Page 115 - Statistics II for Dummies
P. 115
Chapter 5: Multiple Regression with Two X Variables 99
You can get the set of residual plots in two flavors:
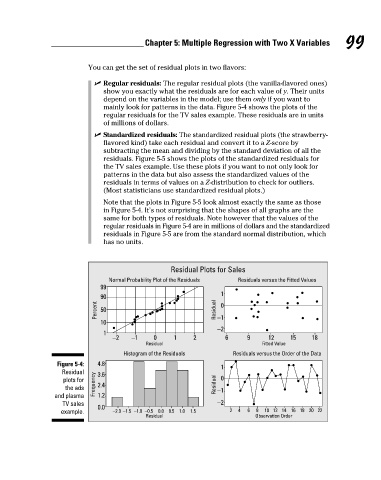
✓ Regular residuals: The regular residual plots (the vanilla-flavored ones)
show you exactly what the residuals are for each value of y. Their units
depend on the variables in the model; use them only if you want to
mainly look for patterns in the data. Figure 5-4 shows the plots of the
regular residuals for the TV sales example. These residuals are in units
of millions of dollars.
✓ Standardized residuals: The standardized residual plots (the strawberry-
flavored kind) take each residual and convert it to a Z-score by
subtracting the mean and dividing by the standard deviation of all the
residuals. Figure 5-5 shows the plots of the standardized residuals for
the TV sales example. Use these plots if you want to not only look for
patterns in the data but also assess the standardized values of the
residuals in terms of values on a Z-distribution to check for outliers.
(Most statisticians use standardized residual plots.)
Note that the plots in Figure 5-5 look almost exactly the same as those
in Figure 5-4. It’s not surprising that the shapes of all graphs are the
same for both types of residuals. Note however that the values of the
regular residuals in Figure 5-4 are in millions of dollars and the standardized
residuals in Figure 5-5 are from the standard normal distribution, which
has no units.
Residual Plots for Sales
Normal Probability Plot of the Residuals Residuals versus the Fitted Values
99
1
90
Percent 50 Residual 0
10 −1
−2
1
−2 −1 0 1 2 6 9 12 15 18
Residual Fitted Value
Histogram of the Residuals Residuals versus the Order of the Data
Figure 5-4: 4.8
1
Residual 3.6
plots for 0
the ads Frequency 2.4 Residual −1
and plasma 1.2
TV sales −2
0.0
example. −2.0 −1.5 −1.0 −0.5 0.0 0.5 1.0 1.5 2 4 6 8 10 12 14 16 18 20 22
Residual Observation Order
10_466469-ch05.indd 99 7/24/09 9:32:35 AM