
Page 117 - Statistics II for Dummies
P. 117
Chapter 5: Multiple Regression with Two X Variables 101
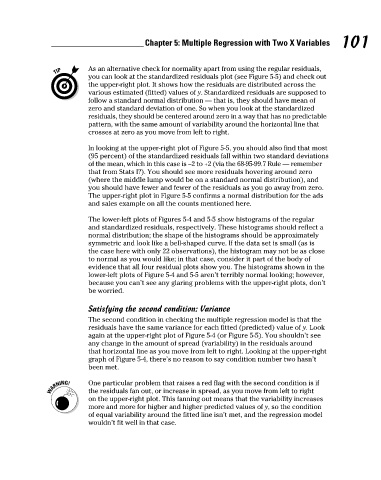
As an alternative check for normality apart from using the regular residuals,
you can look at the standardized residuals plot (see Figure 5-5) and check out
the upper-right plot. It shows how the residuals are distributed across the
various estimated (fitted) values of y. Standardized residuals are supposed to
follow a standard normal distribution — that is, they should have mean of
zero and standard deviation of one. So when you look at the standardized
residuals, they should be centered around zero in a way that has no predictable
pattern, with the same amount of variability around the horizontal line that
crosses at zero as you move from left to right.
In looking at the upper-right plot of Figure 5-5, you should also find that most
(95 percent) of the standardized residuals fall within two standard deviations
of the mean, which in this case is –2 to +2 (via the 68-95-99.7 Rule — remember
that from Stats I?). You should see more residuals hovering around zero
(where the middle lump would be on a standard normal distribution), and
you should have fewer and fewer of the residuals as you go away from zero.
The upper-right plot in Figure 5-5 confirms a normal distribution for the ads
and sales example on all the counts mentioned here.
The lower-left plots of Figures 5-4 and 5-5 show histograms of the regular
and standardized residuals, respectively. These histograms should reflect a
normal distribution; the shape of the histograms should be approximately
symmetric and look like a bell-shaped curve. If the data set is small (as is
the case here with only 22 observations), the histogram may not be as close
to normal as you would like; in that case, consider it part of the body of
evidence that all four residual plots show you. The histograms shown in the
lower-left plots of Figure 5-4 and 5-5 aren’t terribly normal looking; however,
because you can’t see any glaring problems with the upper-right plots, don’t
be worried.
Satisfying the second condition: Variance
The second condition in checking the multiple regression model is that the
residuals have the same variance for each fitted (predicted) value of y. Look
again at the upper-right plot of Figure 5-4 (or Figure 5-5). You shouldn’t see
any change in the amount of spread (variability) in the residuals around
that horizontal line as you move from left to right. Looking at the upper-right
graph of Figure 5-4, there’s no reason to say condition number two hasn’t
been met.
One particular problem that raises a red flag with the second condition is if
the residuals fan out, or increase in spread, as you move from left to right
on the upper-right plot. This fanning out means that the variability increases
more and more for higher and higher predicted values of y, so the condition
of equal variability around the fitted line isn’t met, and the regression model
wouldn’t fit well in that case.
10_466469-ch05.indd 101 7/24/09 9:32:35 AM